1

Users Can Improve Essbase Reporting Performance

Users of Essbase have some control over the performance of a database and how responsive it is when retrieving data.  With a basic understanding of how Essbase stores data, users can optimize performance by changing the order of the dimensions and members in a report.

It might be helpful to read our article on sparse and dense dimensions.  Here is a brief overview:

An Essbase database is comprised of thousands, if not millions or billions, of data blocks.  Each block of data, and its size, is defined by the dense dimensions in the Essbase outline.  The volume of blocks is dictated by the unique combinations of sparse dimension members.  If Time and Accounts are dense, each block created would hold all the months for every account.  If Organization and Product are sparse dimensions, there would be a block for each unique combination of Organization and Product.  A block would exist for Center 10 / Product A, as well as Total Organization / Total Product.  If the outline has 20 members in Organization and 15 members in Products, the database could have up to 300 independent blocks.

If a report is written to show an entire income statement for all 12 months for Total Product and Total Organization, how many blocks would have to be queried?  Remember, there is a block for each unique member combination of Organization and Product.  The answer is one, because there is a block for Total Organization/Total Product that includes every account and every member in the time dimension.

How many blocks would be accessed if a report pulled Total Sales (a member in the Accounts dimension) in January for every product?  Since the Product dimension is sparse and there are 15 products, 15 blocks would have to be opened to return the results.

Here is where your understanding of what sparse and dense represents will help you improve your reports.  Opening a data block, reading the contents, and closing it, is similar to opening, reading, and closing a spreadsheet.  It is much faster to open one spreadsheet, or block, than 15 spreadsheets.  So, if the database retrieves are written in such a way to minimize the number of blocks that need to be accessed, or the order in which they are accessed, performance can improve.

I will agree that if data for all 15 products is needed for the report, all 15 blocks have to be opened.  There is no way around that.  That said, often times users will build one worksheet for income statement and one worksheet for balance sheet.  This means that the report is making two passes on the same blocks.  In theory, it takes twice as long to open/read/close a data block 2 times than it does once.  It is faster to have the income statement and the balance sheet accounts in one worksheet, which only makes one pass on the required blocks.  One worksheet for Income Statement and one for Balance Sheet can be created with cell references to the worksheet that has the retrieved data, if 2 separate reports are required.

I frequently see another example of a report requiring multiple passes to the same data block.  Using our example dimensions above, assume product information is required in a report for multiple accounts.

    Jan Feb Mar
Income Product A      
Income Product B      
Income Product C      
Income Product D      
Expense Product A      
Expense Product B      
Expense Product C      
Expense Product D      

The Essbase retrieve above would start from the top of the spreadsheet and move down the rows to retrieve the data from Essbase.  This cycle would open the Product A block, then B, C, and D, and retrieve the associated income for each.  It would then have to reopen the same 4 blocks to access expenses.

The following example, again going from top to bottom, would access both income and expense while the block is open.  The way this retrieve is setup, it eliminates the need to access the same block multiple times, yet still pulls the required information.

    Jan Feb Mar
Income Product A      
Expense Product A      
Income Product B      
Expense Product B      
Income Product C      
Expense Product C      
Income Product D      
Expense Product D      

These examples are very small.  In a real world example, a report of this size would not produce significant variances in the time it takes to retrieve them.  Users often have spreadsheets that are hundreds of rows long and take minutes to retrieve.  In these situations, eliminating the need to access the same block multiple times can produce notable improvements in the time it takes to retrieve data from Essbase.

With a basic understanding of how your database is setup, users of Essbase can help themselves with some simple changes to the format of the retrieve worksheet.  If access to the dimension properties in your database is unavailable, ask your system administrator to supply them for you.


Sparse, Dense, and Blocks For Dummies

When I am introduced to business segments that use Hyperion Essbase, I always get asked the same question: “Can you explain what sparse and dense mean?”  Although I agree that users don’t HAVE to understand the concept, I contend that it is extremely valuable if they do.  It will not only help them become more efficient users, it goes a long way in helping them understand why something simple in Excel isn’t always simple in Essbase.  If users understand what a block is, and what it represents, they have a much better experience with Essbase.

If you are a relational database developer or a spreadsheet user, you tend to view data in 2 dimensions.  An X and Y axis is equivalent to the rows and columns in your spreadsheet or database table.  Essbase is a little different in that it stores data in 3 dimensions, like a Rubik’s Cube, so it has a Z axis.  Essbase databases refer to these “Rubik’s Cubes” as blocks.  An Essbase database isn’t one giant Rubik’s Cube; it could be millions of them.  The size and number of possible blocks a database has is determined by the sparse/dense configuration of the database.

An Essbase outline has a number of dimensions.  The number of dimensions can range in quantity and size, but each dimension is identified as a dense or sparse dimension.  The dense dimensions define how large each block will be in size (the number of rows, columns and the depth of the Z axis).  The sparse dimensions define the number of possible blocks the database may hold.  Assume the following scenario:  a database exists with 3 dense dimensions and 2 sparse dimensions.  The dense dimensions are as follows:

Net Income
Income
Expenses

Qtr 1
Jan
Feb
Mar

Version
~ Actual
~ Budget
~ Forecast

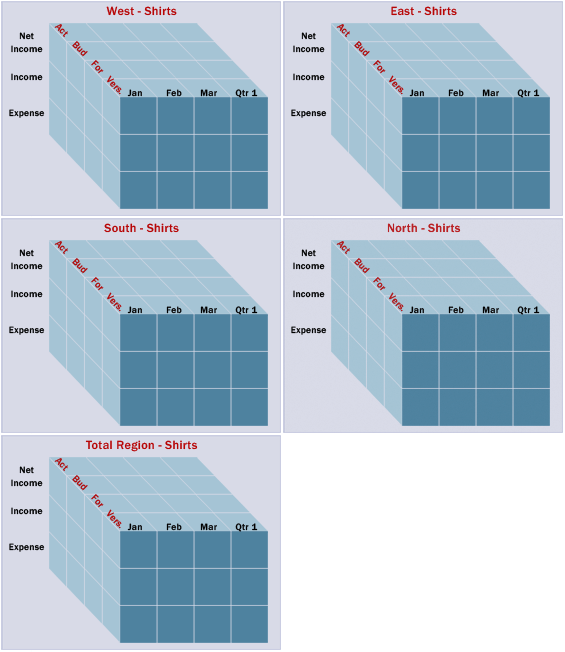
Remember, the dense dimensions define the size of blocks.  These dimensions would produce a block that looks like the image below.  Every block in the database would be the same.

For those more knowledgeable with Essbase design, this example assumes that no member is dynamically calculated or is tagged as a label to reduce complexity.


The sparse dimensions are below.

Total Product
Shirts
Pants

Total Region
North
South
East
West

The unique combinations of each sparse dimension has its own block.  There will be a block for Pants – North, one for Shirts – North, and so on.  Since there are 3 members in the Total Products dimension and 5 members in the Total Region dimension, there will be a total of 15 (3 x 5) blocks.  If a database has 5 sparse dimensions, all with 10 members, it would have a total possible number of blocks equal to 100,000 (10 x 10 x 10 x 10 x 10).  Below is a representation of the possible blocks for Shirts.