1

Building A Planning Application Using EPMA (11.1.2.3)

This post covers the basics of building a Planning app. Building a Planning application can be a straightforward process; however, there are some pitfalls to watch out for. One or two mistakes can lead to some major headaches in trying to decipher what went wrong. Whether a beginner or a seasoned vet looking for a quick refresher, this guide will outline the steps necessary to successfully create/deploy a Planning application.

First, open up the dimension library, and then click File, New, and Application. This will take you to the first screen in the Application setup: Application Type


A. Application Type

There are 3 sections that make up the first screen

  • Application Information
  • Planning
  • Calendar

We will tackle them one at a time…

Application Information:

  1. In this first section, give a name for your application, as well as select Planning from the type dropdown. Giving the application a description is optional
  2. Since we are creating an application using dimensions from the EPMA library, leave “Create Blank Application” & “Auto Create Local Dimensions” unchecked

Planning:

  1. Select the application type (typically this will be General), and select the default currency for the application. You can select “Use Multiple Currencies” but this is not the most effective way of going about it. For more detailed insight on the utilization of multiple currencies in a Planning app, check out the following article:
  2. Select and name the Plan Types that will be in the application. From the screenshot below, the application will have 3 plan types (Plan1, Plan2, Plan3)


Calendar:

  1. Monthly, Quarterly, and Yearly application setup.
    • Base Time Period: This can be 12 months, Quarters, or Custom (if you need a lower level of detail such as weeks)
    • Fiscal Year First Month/Fiscal Year Start Date: Set the first month of the fiscal year as well as if it is the same calendar year or the previous calendar year
    • Weekly Distribution: There are 4 options from this dropdown (Even, 445, 454, 544)
  2. CAUTION: For the following section, both the Period and Year dimensions should be renamed to “Periods” & “Years” if Dynamic Time Series is going be turned on for the application (M-T-D, Q-T-D, Y-T-D, etc). If the dimensions are named Year and Period, Planning will not be able to differentiate between the dimensions and the dynamic time series members, causing errors.
  3. Name the dimension “Years” and select the first fiscal year/number of fiscal years. The number of years ranges from 1-100.

After completing all of the above settings, click next to move on to the next screen, Dimension Selection:


B. Dimension Selection

This screen will have sections for the required, custom, as well as other dimensions for the application. First, the screen will auto populate whatever dimensions are already in the EPMA library. In this example, Entity, Account, and Alias are already filled in. The remaining dimensions (Version & Scenario) need to be populated via the dropdown menu:

These dimensions will be added as local dimensions to the application. Give the dimensions a name and make sure that the type matches the dimension that is being updated:

After setting the required dimensions, the custom dimensions can be selected in the next section. By clicking on the “[Select]” dropdown, the rest of the dimensions from EPMA will be available for selection in the application (note: your dropdown menu will not display the same selection as in this screenshot, as these dimensions had to be created in the Shared Library first):

If there are any Attributes, Smart Lists, or UDA’s that need to be added, the “Other Dimensions” section is the place to do that. Notice that there are 3 different Attributes to choose from in our Test application (I created these in the Shared Library beforehand as an example).

Reviewing the dimensions, there are 4 new local dimensions (Version, Scenario, Years, & Periods), 3 custom dimensions (Customer, Product, & BusinessUnit), & 3 other dimensions (Attribute, SmartList, & UDA). Click Next to go to the Application Settings screen.


C. Application Settings

  1. The entire dimensionality of the new application is available to view/edit. Exclude/add members to the hierarchy as necessary. Make sure that all the dimensions are accounted for.
  2. Properties of the application: This is a review of the application settings from the first screen. Double check that base time period, fiscal start year, and fiscal year first month are set. Also, make sure that the default alias table is set.

After making those changes, click Validate. A list of errors and warnings will populate below. These errors and warnings need to be taken care of before clicking Finish. There are a wide variety of errors that may be encountered such as duplicate members, duplicate aliases, invalid members, invalid plan types, etc. depending on your application. After fixing an error, click validate again and the error will disappear from the list.

Once there are no more errors, the application is ready to be deployed. Click Finish and go to the Application Library and right click, then deploy the application.

Why Can’t Planners Access Essbase

In Hyperion 11.1.2.1, there is a change in how security is deployed. If you are having an issue deploying Planning security with Essbase adhoc access, and the user can’t

  1. Access Essbase Adhoc
  2. Access FR reports using an Essbase connection
  3. Access Essbase directly

you are not alone. This is not classified as a bug, but it sure can cause a lot of frustration. If you have a user that needs access to Essbase directly, the user can’t be associated to ONLY Planning applications. For them to get access to Essbase, even to access the Planning application, they must have security to a native Essbase application (a NON Planning application).

From the Oracle Doc ID 1328741.1

SYMPTOMS

Trying to add the “Essbase” application access type to a Planning user in Shared Services so the user can access native Essbase applications using the Excel Add-in. Shared Services confirms the update when saved but when checking the user again, it only has “Planning” access. This also happens when trying to use the MaxL command to modify the application access type.

CAUSE

Starting in EPM v11.1.2, a user’s type (application access type) cannot be changed by Maxl, the EAS console or manually via Shared services console. The type is automatically assigned based on the roles that the user has.

  • If a user has a role on a Planning application only, then that user is treated as a Planning user.
  • If the user has a role on a Essbase application only, then the user is treated as an Essbase user.
  • If the user has roles on both Planning and Essbase applications the user is treated as a Planning and

Essbase user.

SOLUTION

In order for a Planning user to access native Essbase applications in the Excel Add-in, the user will need to be given access to a native Essbase application. For example, assign the Planning user “Read” access to the Demo application.


My Grid Rows Aren’t Aligned To My Data Rows

No, your eyes aren’t playing tricks on you. The grid lines don’t align with the row headers. It is very slight on smaller forms, but forms with hundreds of rows compounds the issue. The further down the grid, the more of an issue the offset is.

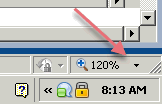
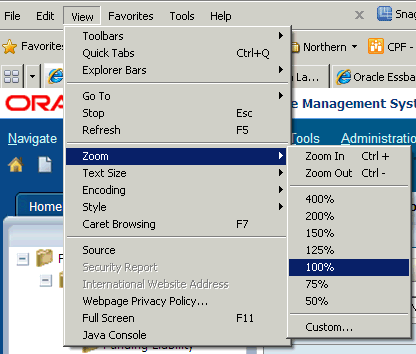
If you have ever seen this issue and pulled your hair out trying to figure out why it happens with some users and not others, fixing it is embarrassingly (now that I know) easy. Change the zoom in IE back to 100%!

Take a look at the bottom right area of IE.  If you see that the zoom is NOT 100%, select the View / Zoom / 100% menu.

Hopefully this will save you some time if you ever run accross this issue.


Article Now Available in InVision

Josh Forrest and I presented at last year’s Collaborate conference.  Along with that presentation, we wrote a white paper on the implementation of Hyperion Planning.  This paper included process of selecting a vendor, the project goals, requirements gathering, project methodology, and even the lessons learned once the implementation was completed.

The editors of OAUG asked us if they could publish the article in the summer edition, which was released this week.  The article was written closely with Abercrombie & Fitch and represents the process from the business, not from the consulting services, point of view.

The article can be downloaded here at www.oaug.org.  Access to the article requires free registration.


BUG REPORT – Shared Members Security in EPMA

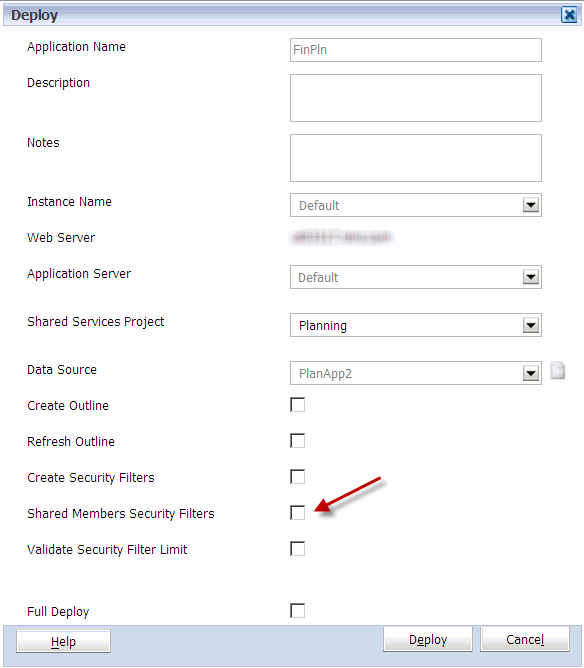
Oracle has confirmed a bug related to the deployment of security with a planning application maintained in EPMA in version 11.1.2.x.  When the Shared Members checkbox is selected in an EPMA deployment of a Planning application, it ignores this option.  Even if the Shared Members box is checked, the user still only gets access to Ohio Region, and not the children, in the example below.   Oracle is currently working on a patch.

What Does Checking Shared Members Do?

By default, any member that is a shared member under a parent with security, it gets excluded.  For example, if the security for Ohio Region is set to @IDESCENDANTS with READ access, the three members below Ohio Region would have no access.
– Ohio Region
– Columbus (Shared)
– Cincinnati (Shared)
– Cleveland (Shared)

The filter that gets pushed to Essbase would look something like this.

@REMOVE(@IDESCENDANTS(“Ohio Region”),@SHARE(@IDESCENDANTS(“Ohio Region”)))

When the shared members are checked, it tells Hyperion that you want to include shared members in the security.  The same example above, with shared members selected, would give users access to all 3 members.  The filter that gets pushed to Essbase would then look like this.

@IDESCENDANTS(“Ohio Region”)

The Workaround

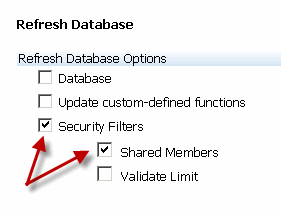
The workaround for this is to deploy the hierarchies from EPMA, and Refresh the database (security only) with Shared Members selected from Hyperion Planning.

When a patch is released, we will release the details.


Increased Efficiency Utilizing Saved Objects in Financial Reporting

All developers understand the power of using objects during development activities, a concept that can be leveraged in the development of Oracle/Hyperion Financial Reports. Utilizing saved objects allows the development team to deliver a product in less time and provides the ability to quickly react to future report modifications. The information below (1) provides common saved object examples and (2) displays how saved objects are created and used.

What type of report information should be converted into saved objects?

The goal behind utilizing saved objects is to avoid the recreation of code, thus I find it valuable to turn all report header and footer information into saved objects. Items such as company logo’s, report title/sub-tile information, dimensional point-of-view selections, date & time stamps, page numbers and data source information make for great saved objects as they typically reside on all financial or management reports.

The usefulness of report objects may seem less important during the early stages of development, but as your reporting repository grows, their impact becomes increasingly important. For example, changing a company logo on a few reports is a minor incontinence, but making that same change to 50 reports could take hours to complete, resulting in the inefficient use of development/ maintenance time.

How are saved objects created and used?

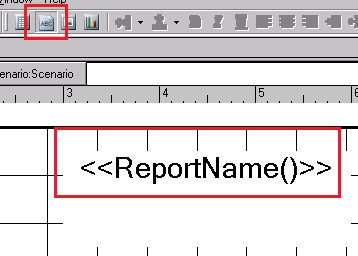
Creating saved objects is a simple process that requires one additional step after the initial creation of your object. The example below walks through the process of creating a report title saved object. The same process will be used in the creation of all reporting saved objects.

Step 1 – Create your Object:


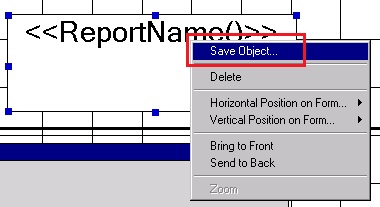
Step 2 – Save the Object:

Right-click the object and select Save Object…

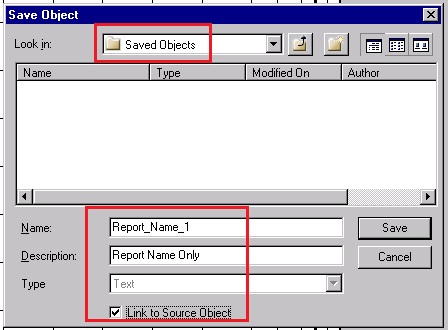
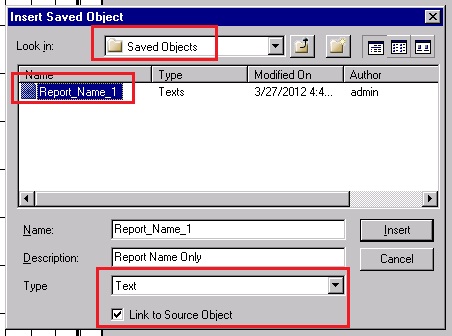
Best practice involves the creation of a Saved Object folder in the report repository where all saved objects will reside. Notice the use of this folder below.

IMPORTANT – Be sure to place a checkmark next to “Link to Source Object”. This link enables future modifications of this object to resonate across all reports where this object exists. This checkbox allows for the increased efficiency when developing and maintaining reports.

Once the report has been saved, notice the object name changes.


Step 3 – Use your Saved Object:

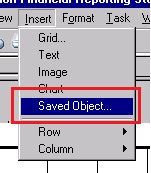
Once the object has been saved you can reference it in future report development via the link. Create a new report and insert the saved object.


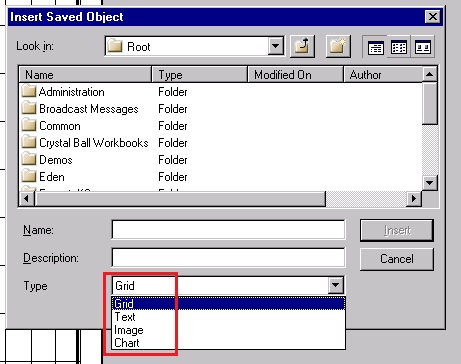
Be sure to select the Type of “Text” (It will always default to Grid) and place a checkmark next to “Link to Source Object”. 

FYI: When inserting saved objects you have 4 choices (Grid, Text, Image and Chart). Be sure to select the correct type in order to locate the desired saved object.

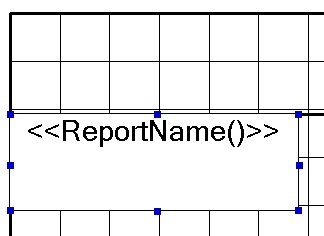
Note that when saved objects are inserted, they are placed in the body of the report by default; the developer will need to place the saved object in the correct position on the report.


Join Us In San Antonio!

KScope12 is the premier conference for Hyperion techies and up-and-comers. Whether you are looking to brush up on your skills, learn new skills, or see how others overcome challenges, you will want to participate in this event. If your organization values your development and has a budget for these growth opportunities, mark your calendar for June 24th through the 28th. Registration is open, and as more information is available, it will be published at In2Hyperion.

Presenting a topic is a great way to reduce the cost of the trip. It’s a great way to get your name out in the community as well. If you have something that you think would be valuable for other experts to hear about, submit an abstract.

We hope to see you there. Visit www.kscope12.com for all travel details and abstract submissions.


Managing More With Less Doesn’t Have To Be Impossible


We will always be asked to do more with less. Finance is asked to produce more and better analytics with less people. Sales people are asked to produce more in a weakening economy with less marketing dollars, and yes, groups that manage Essbase environments are asked to produce and manage more data/applications with shrinking resources.

Back in the Day

In a prior life, I used to manage a group responsible for managing the Essbase environment used to produce all the reporting for the group. It generated about 70% of the revenue for Bank One (now Chase). We delivered all the reporting, budgeting, and forecasting applications. It included nearly 2 TB of data (pre ASO) on four servers that included more than 50 databases. All the typical technologies were employed. A large number of filters existed to maintain security. Many of the applications were linked together with several types of partitions. Data was loaded daily, weekly, and monthly. SQL Server was used for all the ETL processes, and we completed the development and performed all the maintenance with four people.

The only way the group could be effective in developing and enhancing applications, was to eliminate our effort spent on typical production activities. With the number of applications and the frequency they were updated (daily, weekly, or monthly), communicating this information to the more than 250 users was also a large time commitment.

The Solution

We built custom applications using the Essbase API to not only automate the tasks, but also notify the appropriate person if there was an error. This included everything from data loads, application builds, ETL processing, nightly data exports, repetitive calculations, and every other aspect of the maintenance. We even automated the validation of the data during the load process. Data loaded to the ETL layer was compared to the ETL Export. After the data was loaded to the Essbase application, we automated Excel data retrieves and compared them back to the ETL data exports. We effectively eliminated any effort it took to maintain the environment unless an error occurred that required attention. This was the ONLY way we could keep our heads above water.

We chose the API because it is so robust. It has most of the Maxl functions. It introduces the ability to check for errors at any point in the process, and can take the appropriate steps to resolve. No manual intervention was required. The same application can interact with the ETL layer, send text messages or pages, email administrators and users, and update web pages with statuses that the users can see (like the state of the load process, calculation status, etc.).

This solution may be overkill for very small implementations of one or two applications. But, don’t underestimate its importance in medium to large-scale operations. It minimizes costs, reduces errors, provides a better user experience, and minimizes delays in new development.

I highly recommend investigating how this would work for your group. Although I used the Visual Basic API, there are also libraries for C and Java.


What’s New with Smart View

The newest release of Smart View (Release 11.1.2.1.102) includes many helpful, long-awaited features sure to both enhance the end-user experience and increase productivity. Many of the new features are examined below while a complete list and their descriptions can be found here.

Ad Hoc Operations in Multiple Cells

Previous versions of Smart View limited users to cell level ad-hoc operations. For example; say you wanted to ‘Zoom In’ on a member, Smart View limited this action to a single cell (single member). The newest version allows users to select a range of cells before performing an action allowing for quicker answers. Multi-cell actions such as Zoom In, Zoom Out, Keep Only and Remove Only are now permitted.  

Member Information

End users of Smart View often struggled to find additional information pertaining to members of a dimension from which they queried. This problem has been remedied with the new ‘Member Information’ button located in the Essbase ribbon. When focused on a single Essbase member, users can click the Member Information button and be presented with multiple member properties such as:

  • Dimension Name
  • Member Level
  • Member Generation
  • Parent/Child Name
  • Consolidation Operator
  • Alias Tables
  • Alias Names
  • Attributes
  • Formulas
  • Comments
  • User Defined Attributes (UDAs)

Linked Objects

End users with proper access can now add/ access ‘Linked Reporting Objects’ and ‘Linked Partitions’. Having Linked Reporting Object access allows for cells notes, external files and URLs to be linked to Smart View data cells for reference. Access to Linked Partitions enables connection between 2 separate databases. This allows users to navigate database ”A” while connected to database “B”, opening up additional data analysis opportunities.

Displaying Member Names and Aliases

Previous versions of Smart View generated a common complaint centered on the display of member names versus aliases. Essbase and Planning users familiar with the Essbase Add-In were accustomed to displaying both member names and aliases in a retrieve. These users had become frustrated by Smart View’s inability to function similarly. This problem has been fixed with Oracle’s latest release whereas users now have the option to display member names and their aliases, side-by-side, on retrieves.

POV Toggle

The ‘POV Toggle’ button allows end-users the ability to move dimensions from the Smart View POV Toolbar to row one, thus placing all dimensions on the grid. Users familiar with the Essbase Add-In will appreciate this functionality, allowing ‘power users’ quicker retrieve setup times. This can easily be switched back with the click of the POV Toggle button.

Sheet Level Options

Previously, all Smart View specified Options were global in nature. Options found in the ‘Options’ dialog box including ‘Member Options’, ‘Data Options’ and ‘Formatting Options’ are now sheet specific, allowing for multiple sheets to function with their own definitions. This means ‘Sheet 1’ could drill to the bottom level and display only member names while ‘Sheet 2’ could drill to the next level and display the combination of member name and alias. Note that options found in ‘Advanced Options’, ‘Cell Styles’ and ‘Extensions’ remain global in nature.

Butterfly Reporting

One of the commonly used features of Financial Reporting involves the use of ‘Butterfly’ reporting. Butterfly reports display a column of dimensional members between two columns of data.

New Zoom Options

Users now have additional ‘Zoom’ options including:

  • Same Level
  • Sibling Level
  • Same Generation
  • Formulas (retrieve data for all members that are defined by the formula of the selected member)

Submit Data without Refreshing

Gone is the requirement to refresh a grid prior to submitting data while in Free-Form mode.


As noted above, this review includes many, but not all new features released with Smart View 11.1.2.1.102. Please visit Oracle for a complete list and description of each new feature.


Is Your Message Getting Ignored?

Think about how many emails you delete without reading. Your inbox gets cluttered with specials from your favorite stores that you requested to be sent.  You just but didn’t realize a new email would show up every other day. Everyone has the friend who sends emails that he or she thinks is so funny that aren’t. There’s also the person who seems to update his status multiple times a day and “checks in” at the grocery store, work, dinner, etc. Sometimes it’s your system administrator sending you updates about every aspect of the system that you delete. Then you think, Wait, I am the administrator. My emails are always read!  Right?

Are You That Friend?

Well, I hate to tell you, but to your users, you may be the “that” friend. You may be the one telling them what time you woke up, when you got to work, and where you ate dinner.  You may be on the dreaded auto delete list.  Your email might be the email that triggers the twitch and the water cooler comments.  The big question is, What happens to that one important email out of the 20 you send?

How To Remove Yourself From The Auto-Ignore List

If you are a system administrator, it’s critical that you filter the information to your users to minimize the irrelevant communication.  Not all your users require the same information.  Here are some suggestions that may improve your communication and limit the frustration of your user population.

  1. Only send out global communications when it is appropriate.  If only one of your servers will be impacted, make sure only the users that will be impacted are notified.
  2. If you have more than one application, create a distribution list for each one.  This will ensure that relevant information is sent to the appropriate users.
  3. If you have users with different responsibilities, make sure you separate those responsibilities.  If information is sent out about when the system will be open to change a budget or forecast, only inform those that have the ability to make those changes.
  4. Let your users choose what they are notified about.  If you have a list of topics that are typically communicated, let your users decide which email groups they associated with.

When developing this methodology, use careful consideration about your approach.  For environments including only a few applications and a small population of users, don’t try a multi-tiered solution.  A spreadsheet would likely meet your needs.  For environments that are larger, think about the implications of managing these lists with a lot of applications and hundreds of users. Managing offline lists could become a job in itself, and become outdated and useless over a short period of time.

A Thought

Prior to consulting, I managed a fairly large environment.  We had more than 250 users and 10 to 20 applications.  They ranged from field headcount reporting, to home office budgeting and forecasting.  The approach I used was not complicated, it was easy to setup, and it gave the users all the control in deciding what they received.  A relational database was created to hold the distribution lists, users, and their emails.  Users could access this from a website (one asp/.net web page) that allowed them to enter their email, return the topic groups they are associated with, and allow them to change it in real-time.  Any time a new distribution group was added, a global email was sent out notifying everyone of the addition.  Email distributors (in our case, the system administrators), could use this website to send out emails by selecting which groups should be notified.

Happy Customers

This approach above took less than a day to create.  It significantly reduced the frustration from the user population. They only received emails they wanted to receive, they were aware of the different types of communication, and THEY controlled the amount of communication they received.  By empowering them, critical information was far less overlooked.