1

Remove Dimensions From Planning LCM Extracts

Problem

I am currently working with a client that is updating a planning application and one of the changes is to remove a dimension.  After the new application was setup and the hierarchies were modified to meet the objectives, migrating artifacts was the next step.  As many of you know, if you try to migrate web forms and composite forms, they will error during the migration due to the additional dimension in the LCM file.  It wouldn’t be a huge deal to edit a few XML files, but when there are hundreds of them, it is extremely time consuming (and boring, which is what drove me to create this solution).

Assumptions

To fully understand this article, a basic understanding of XML is recommended.  The example below assumes an LCM extract was run on a Planning application and it will be used to migrate the forms to the same application without a CustomerSegment dimension.  It is also assumed that the LCM extract has been downloaded and decompressed.

Solution

I have been learning and implementing PowerShell scripts for the last 6 months and am overwhelmed by how easy it is to complete complex tasks.  So, PowerShell was my choice to modify these XML files in bulk.

It would be great to write some long article on how smart this solution is and overwhelm you with my whit, but there is not much too it.  A few lines of PowerShell will loop through all the files and remove the XML tags related to a predefined dimension.  So, let’s get to it.

Step 1 – Understand The XML

There are two folders of files we will look to.  Forms are under the plan type and the composite forms are under the global artifacts.  Both of these are located inside the resource folder.  If there are composite forms that hold the dimension in question as a shared dimension, both will need to be impacted.  Scripts will be included to update both of these areas.

Inside each of the web form files will be a tag for each dimension, and it will vary in location based on whether the dimension is in the POV, page, column, or row.  In this particular example, the CustomerSegment dimension is in the POV section.  What we want to accomplish is removing the <dimension/> tag where the name attribute is equal to CustomerSegment.

For the composite forms, the XML tag is slightly different, although the concept is the same.  The tag in composite form XML files is <sharedDimension/> and the attribute is dimension, rather than name.

Step 2 – Breaking Down the PowerShell

The first piece of the script is just setting some environment variables so the script can be changed quickly so that it can be used wherever and whenever it is needed.  The first variable is the path of the Data Forms folder to be executed on.  The second is the dimension to be removed.

# Identify the source of the Data Forms folder and the dimension to be removed
# List all files, recursively, that exist in the path above
$files = Get-ChildItem $lcmSourceDir -Recurse | 
where {$_.Attributes -notmatch 'Directory'} |

The next piece of the script is recursing through the folder and storing the files in an array.  There is a where statement to exclude directories so the code only executes on files.

# List all files, recursively, that exist in the path above
$files = Get-ChildItem $lcmSourceDir -Recurse | 
where {$_.Attributes -notmatch 'Directory'} |
Step 3 – Removing The Unwanted Dimension

The last section of the script does most of the work.  This will loop through each file in the $files array and

  1. Opens the file
  2. Loops through all tags and deletes any <dimension/> tag with a name attribute with a value equal to the $dimName variable
  3. Saves the file
# Loop through the files and find an XML tag equal to the dimension to be removed
Foreach-Object {

$xml = Get-Content $_.FullName
$node = $xml.SelectNodes(“//dimension”) |
Where-Object {$_.name -eq $dimName} | ForEach-Object {
# Remove each node from its parent
[void][/void]$_.ParentNode.RemoveChild($_)
}
$xml.save($_.FullName)
Write-Host “($_.FullName) updated.”
}

Executing The Logic On Composite Forms

The above concepts are exactly the same to apply the same logic on composite forms files in the LCM.  If this is compared to the script applied to the web forms files, there are three differences.

  1. The node, or XML tag, that needs to be removed is called sharedDimension, not dimension. (highlighted in red)
  2. The attribute is not name in this instance, but is called dimension.  (highlighted in red)
  3. We have added a counter to identify whether the file has the dimension to be removed and only saves the file if it was altered.  (highlighted in green)
The Script
$lcmSourceDir = "Z:\Downloads\KG04\HP-SanPlan\resource\Global Artifacts\Composite Forms"
$dimName = "CustomerSegment"
# List all files
$files = Get-ChildItem $lcmSourceDir -Recurse | where {$_.Attributes -notmatch 'Directory'} |
# Remove CustomerSegment
Foreach-Object {
  # Reset a counter to 0 - used later when files is saved
  $fileCount = 0

$xml = Get-Content $_.FullName
$node = $xml.SelectNodes(“//sharedDimension“) | Where-Object {$_.dimension -eq $dimName}  | ForEach-Object {
#Increase the counter for each file that matches the criteria
    $fileCount++
# Remove each node from its parent
[void][/void]$_.ParentNode.RemoveChild($_)
}
# If the dimension was found in the file, save the updated contents.
  if($fileCount -ge 1) {
$xml.save($_.FullName)
Write-Host “$_.FullName updated.”
    }
}

Summary

The first script may need to be run on multiple plan types, but the results is an identical folder structure with altered files that have the identified dimension removed.  This can be zipped and uploaded to Shared Services and used to migrate the forms to the application that has the dimension removed.

The scripts above can be copied and pasted into PowerShell, or the code can be Downloaded.


Use PowerShell to split large files by month/year for data loads into FDMEE on PBCS

If you are using PBCS, you may run into some challenges with large files being passed through FDMEE.  Whether performance is an issue or you just want to parse a file my month/year, this script might save you some time.

The Challenge

I recently had the need to break apart a file.  The source provided one large text file that included 2 years of data that was needed to populate the history of an employee metrics application.  The current process loaded files by month and we wanted to be able to piggy back off the existing scripts to load and process data in FDMEE and the monthly Planning data pushes to the ASO reporting cube.  So, the need break the data file into seperate files by month and year was required.  The file was delimited and formatted like the following.

Entity,Year,Scenario,Period,Account,Date,Employee,Pay Code,JobNumber,Data
BU1005,FY15,Actual,Feb,Pay Amount,02/02/2015,V1398950,P105,,108.10
BU1005,FY15,Actual,Feb,Pay Amount,02/03/2015,V1398950,P105,,108.92

The goal was to have a file for every unique month and year combination that included only the lines of the relevant time periods.  The header of the file also had to exist in each of the smaller files.  Since we were working on a Windows machine, we used PowerShell to script the solution.

Powershell Script Directions

The script is pretty simple to use and understand.  Update the script as follows.

  1. Create a new text file with a ps1 extension and paste the following into that file.
  2. Update the srcFile variable to point to the file to be parsed.
  3. Update the startYear to the first year in the file to be extracted.
  4. Update the currentYear variable to the last year in the file to be extracted.
  5. Update the ProcessName to a meaningful word or phrase that will be used to create the file name.
  6. Save the file and execute it like any other PowerShell script.

This will produce 12 files for each year with the header line and the data related to the month and year that represents the year and month in the file name.

Disclaimer

I welcome feedback on improving performance and will give credit to anybody that can improve on this.  I am NOT an expert in PowerShell and I am sure there are faster ways to accomplish this.  This created 12 files (1 year / 12 months) from a file that includes 7.8 million records and completed in 24 minutes.  So, this is pretty reasonable for one-off requests, but might need attention if it was a repeatable need.

This was developed using PowerShell 5 and some functions do not work in earlier adoptions of the software.

Powershell Script

#######################################################################
# Set the file to parse
# 
# Set the start year and end year
# 
# Change the counter if you want the files produced to start at
# something other than 1
#######################################################################
# Write a status to the screen to monitor progress
write-host "Processing started at $($(Get-Date).ToShortTimeString())"

# Update to point to the source file
$srcFile = "C:\Oracle\GCA\Data\Files\2015 Time Data\Time_DataPayAmount2015.csv" 

# Set to the first year you want to process
$startYear = 2015 
# Set to the last year you want to process
$currentYear = 2016 

# Used in the naming, is the starting number in name and increments by 1
$counter = 1 

# Get the first line (the header line) of the file 
$Header =  Get-Content $srcFile -First 1 

# Set the process name used in the file name 
$ProcessName = "Test Process" 

# Loop through each year in the range 
ForEach ($Years in $startYear..$currentYear )
 {
   # Loop through each month of the year
   ForEach ($months in 1..12 )
   {
     # Get the 3 month abbreviation of the month being processed
     $ShortMonth = (Get-Culture).DateTimeFormat.GetAbbreviatedMonthName($months)

     # Format year to FYxx (This is typically required on a Planning application)
     $FormattedYear = "FY" + 
     $Years.ToString().substring($Years.ToString().length - 2, 2)

     # Set the file name to a number starting with 1, the Month, and the year
     # Example: 01_ProcessName_Jan_2015.txt
     $FileOut = "{0:00}" -f $counter++ + "_" + $ProcessName + "_" + 
     $ShortMonth + "_" + $Years + '.txt'

     # Write out the header to the newly created file file
     $Header | out-file -filepath $FileOut -Encoding utf8  

     # Write out all the lines that match the month and year. The pattern 
     # includes a ".*" which is the equivalent of an AND conjunction, so 
     # the line has to include the processing year AND processing month 
     # for it to be included.
     select-string $srcFile -pattern "${FormattedYear}.*($($ShortMonth))" | 
     foreach {$_.Line} | out-file -filepath $FileOut -Encoding utf8 -Append

     # Write a status to the screen - this is not required but provides a level
     # of the current progress by communicating the Month/Year completed and the
     # time it completed  
     write-host $fileout "Completed at $($(Get-Date).ToShortTimeString())"
   }
 }

Conclusion

Hopefully this will benefit the community.  As I create more scripts like this, I plan to share them.


Map Smart List to Dimension

As you all notice PBCS does not yet offer the possibility to create attribute dimensions. One of the solutions to get around this is to choose to map a smart list to a dimension in the map reporting module. Follow the steps below to configure your mapping.

Let’s assume that you already have 2 plan types, one BSO and one ASO. In the example below, my plan type names are Finance for the BSO and rFinance for the ASO. In the project where I implemented this solution, I only needed 2 different attributes (Department and Service type) and I didn’t need any customized dimensions.

  • First you need to create the ASO dimensions representing the desired attributes. In my example I have two different attributes: Department and Service Type. On each of these dimensions create the members representing the value of your attribute. Please note that the members’ name must match the value of the smart list consequently, they need to follow the naming convention of the smart list (no spaces or special characters). You will also notice that for each of the dimensions I have created a default member (No_***), I will explain why I did this a bit later on in the post.
  • On the second step we will create the smart list. To do that click on Administration -> Manage -> Smart lists. Then create the new smart lists by clicking on add.

    For now just create the smart lists, we will add value in other steps.
  • Now, we will create the BSO members linked to the smart list. Go to your BSO outline and on the account dimension create 4 members’ names, Department Property, Department Property Input, Service Type Property and Service Type Property Input. Link these members to the correct smart list.
  • Once this step in finished go to refresh the app by clicking on Administration -> Application -> Refresh Database.
  • Now that all members and smart lists are created, let’s create the map reporting application. To do that click on Administration -> Map Reporting Application then click on add.

    On the first tab choose your source (Finance) and reporting (rFinance) application, and don’t forget to add a name to the map reporting.
    On the second tab for the department and service type row choose the Smart List to Dimension mapping type, and then choose the appropriate smart list. On the member section choose Department Property and Service Type Property members and click on save.
    Now you should see on the screen the application mapping that you have just created. Select it and refresh it by clicking on refresh
  • Now we will go back to the smart lists that we created in the second step. Since we have linked these smart lists to a dimension, we can now update them automatically. This can help you save a lot of time if you have smart lists with 50 members or more.
    To do this, go on the smart list screen (see step 2). Once you are there, select the smart list and click on synchronize.

    Once this is done, the message below should appear.
  • In order to make the smart list to dimension work, we need to assign an attribute value to every intersection for which we have data. For easy maintenance and to avoid business rules that are running for too long, we will do this by attaching a formula to a member (Department Property and Service Type Property). Go to your outline and edit these members by making them dynamic and by adding the formula that you see in the screen shot below (this formula might need to be updated depending on the name and number of dimensions that you have in your application). You will see in the formula that I’m defaulting the value of the attribute to No_Department, this is because you can’t leave any intersection #missing it will lead the map reporting to an error.
  • The final step is to create the form where the user can set up the attribute of their choice for every entity.
    Go to the form panel to create your form, in the POV section put the member that you put in the above formula. In the row put the level 0 entity and in the column put the member Department Property Input and Service Type Property Input.
    You can now push your data using the previous map reporting application.
Pro: This solution is very easy to maintain for the admin, and if needed you can also let a user play with the attributes.
Con: If you have too many attributes, this can make the size of the application get too big and consequently slower.


Essbase Security: Setting Filters to Groups

For most Essbase applications, user and group security will be a necessity. Here are the steps to set up individual filters and then apply them to a group in Shared Services.

First, create a security filter in Essbase:

Then click on “New” and add read/write access for the filter:

Here is an example of the member specification for filter access:

Next, click Verify and then Save at the bottom of the page.

The next step is to login to Shared Services and create a new group:

The group name should match the filter name to reduce opportunities for confusion. While creating the group, add group/user members:

Next, the group will need to be provisioned for access to the desired application:

For Read/Write access only, assign “Filter” to the group:

For access to run calc scripts on the application along with Read/Write access, assign “Calc” to the group:

The next step is the part that has always been the trickiest piece for me. Right click on the application under Application Groups and select Access Control:

Search for the desired group and move it to the selection window on the right:

Select the desired group and then use the filter & calc dropdowns to select the required filters and/or calc scripts to assign to the group:

Click save after the desired access control for the group has been set. Remember, calc’s can only be assigned if the group was given “Calc” provisioning for the application.

Now the security filter has been successfully assigned to a group in Shared Services.


One at a time, please

Introduction

One of the problems with giving users of Hyperion Planning the ability to run calculations is opening up the possibility for all of them to run the same calculation at the same time.  This can cause a range of issues, from slower performance, to calculations never finishing due to locked blocks, to crashing the server.

Prior to Planning, I created VB applications to monitor what was calculated to make sure multiple calculations were not executed at the same time.  Initiating a calculation through a web portal allowed us to notify the user that the calculation request was ignored because a calculation was already running.

Both Essbase and Planning have come a long way since the 90s.  With the introduction of the @RETURN function, developers can interact with users and create a break in a calculation (business rule) so it doesn’t proceed.  The message is still reactive, but with some creativity, there are some really awesome things you can achieve.  Controlling what calculations are executed simultaneously is one of those things.

The Goal

Assume an application has a global consolidation calculation that is required to be executed for reporting requirements.  Since the administrators don’t want to be bothered at all hours of day and night, they want to enable the users to run the calculation and ensure it isn’t run more than one time during the calculation window.

This assumes the 6 required dimensions in Planning, plus a Department dimension.

The Method


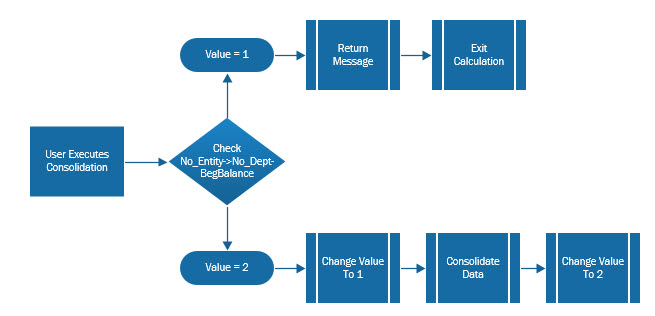
Make a predefined placeholder where an indicator can be saved – a 1 or a 2.  When the calculation is executed, the value will be set to a 1.  When the calculation is finished, the value will be set to 2.  When the calculation is initiated, it will check that value.  If it is a 2, the calculation will execute.  If it is a 1, it assumes a calculations is already running so it will abort and notify the users.  This ensures that the calculation will never run twice at the same time.

Note:  I prefer the use of 1 and 2 over 0 and 1.  Many times a process is implemented to eliminate zeros and restructure the application periodically.  Not using a zero can eliminate errors in some situations.

Example

FIX("No Entity","No_Dept","No Account","Budget","FY15","BegBalance")    SET CREATEBLOCKONEQ ON;    "Working"(      /* Check to see if a calculation is running         If the flat is a 1, return a message and stop the calculation         If the flag is a 2, continue */      IF("Working" == 1)        @RETURN ("This calculation is already running.  Please come back at a
                       later time and try again.", ERROR);      ELSE        "Working" = 1;      ENDIF)    SET CREATEBLOCKONEQ OFF;  ENDFIX     /* Aggregate the database */  FIX("Working","Budget","FY15")    AGG("Entity","Department");  ENDFIX     /* Set the flag back to 2 */  FIX("No Entity","No_Dept","No Account","Budget","FY15","BegBalance")    "Working" = 2;   ENDFIX

Summary

This method could be used in a variety of situations, not just a global calculation.  If this inspires you to use the @RETURN in other ways, please share them with the In2Hyperion and we can make your solution available to everybody.


Recommended Settings for Oracle Hyperion Products

Problem

Oracle has recommended settings for Internet Explorer (IE7, IE8, IE9, IE10 and IE11) when using Hyperion products.  I get this question a lot from my clients, so I thought I would share Oracles suggested settings.  Without changing these, there will be intermittent problems, and frustration points.

Solution

Configure browser to check for new version every time user visits a page

  • Open Internet Explorer
  • Go to Tools > Internet options > General
  • In “Browsing history” section click on “Settings” button and then select “Every time I visit the webpage” option
  • Click OK, then Apply.

Disable default pop-up blocking

  • Open Internet Explorer
  • Go to Tools > Internet options > Privacy tab
  • Uncheck “Turn on Pop-up Blocker”

Add Workspace URL to trusted sites

  • Open Internet Explorer
  • Go to Tools > Internet options > Security tab
  • Select “Trusted sites” from “Select a zone to view or change security settings” window, then click on “Sites” button.
  • Type your workspace URL in form http://workspaceserver:portnumber in “Add this website to the zone”
  • Uncheck “Require server verification (https:) for all sites in this zone”
  • Click Add, then Close.
  • Click OK and Apply.

Customize security settings

  • Open Internet Explorer
  • Go to Tools > Internet options > Security tab
  • Select “Trusted sites” from “Select a zone to view or change security settings” window
  • Select zone containing your Oracle Hyperion servers and click on “Custom level…” button
  • In “Miscellaneous” section enable options “Access data sources across domains” and “Allow script-initiated windows without size or position constraints”
  • In “ActiveX controls and plug-ins” section enable “Run ActiveX controls and plug-ins” and “Script ActiveX controls marked safe for scripting”.
  • Click OK
  • Click Apply, then OK

Enable option “Always allow session cookies”.

  • Open Internet Explorer
  • Go to Tools > Internet options > Privacy Tab > Advanced. Check the “Override automatic cookie handling”, accept the first and third party cookies and check the “Always allow session cookies” option.

Only for SSL enabled environments: Disable option “Do not save Encrypted Pages to Disk”.

  • Open Internet Explorer
  • Go to Tools > Internet options > Advanced Tab. In “Security” section uncheck the option “Do not save Encrypted Pages to Disk”.

Disable option “Enable Native XMLHTTP”. This setting is recommended only for customers using HFM 9.3.1 or older with IE 7. If you are using version 11.1.1.x of EPM products or newer, this option should be enabled.

  • Open Internet Explorer
  • Go to Tools > Internet options > Advanced Tab. In “Security” section uncheck the option “Enable Native XMLHTTP”.

Using Internet Explorer 9 Compatibility View option.

  • Open Internet Explorer
  • For 11.1.2.1.600 Planning and EPMA: Compatibility View should be enabled in Tools > Compatibility View Settings
  • For EPM 11.1.2.2 products: Go to Tools > Compatibility View Settings. Make sure EPM Workspace URL is not enabled for Compatibility View and uncheck all available options at the bottom of the pop-up window.

For products using JRE Plugin (Web Analysis, Performance Scorecard, Administration Services) make sure that a compatible version of plugin is installed on the client machine.

  • Check JRE Plugin certification for your EPM product in support matrix
  • Check installed Java version in Control Panel > Java > General > About. If required update Java version to a supported release.
  • Enable option “Always Auto-Download” in Control Panel > Java > Advanced > JRE Auto-Download=

Using Internet Explorer 11 Enterprise Mode. Limited support with EPM 11.1.2.2.500 and 11.1.2.3.500. For more information see Document 1920566.1.


Essbase (ASO): Clearing Data Using CrossJoin

Having been working on an ASO project for the last couple of months, I have learned a lot about Essbase and its related software. One of the things that gave me trouble at first was the syntax of CrossJoin in ASO’s MDX language. More specifically, I was having trouble trying to nest multiple CrossJoin’s together when I was trying to clear out a certain portion of data that included more than two dimensions. A CrossJoin is simple; it returns the cross-product of two sets from two different dimensions. But what if I want to return the cross product of four different dimensions? That one proved to be a little trickier

Before tackling a CrossJoin of four dimensions, let’s look at a the basic syntax of the function. Below is an example from Oracle’s documentation of a simple CrossJoin (it is using members from the Year & Market dimensions in the Sample Basic outline):

Notice that all 4 possible combinations of the members are returned by the CrossJoin. This is straightforward enough. The part I had the most trouble with occurred when I started trying to include multiple CrossJoin’s in the statements. All of the statements & brackets seemed to jumble together. I figured it would be most helpful to provide examples of what I ended up using so that you can see the syntax:

Note: Since these CrossJoin’s were used to delete data, all of the members being selected are Level 0. I’m also using the ASOsamp Sample ASO outline to demonstrate the functionality.

Simple CrossJoin:

  • CrossJoin({[Original Price]},{[Curr Year]})

Double CrossJoin:

  • CrossJoin(CrossJoin({[Original Price]},{[Curr Year]}),{[Jan]})

Triple CrossJoin:

  • CrossJoin(CrossJoin(CrossJoin({[Original Price]},{[Curr Year]}),{[Jan]}),{[Sale]})

Above demonstrates a sample syntax that will use CrossJoin to bring together four different dimensions. However, it is only grabbing one member from each dimension. To grab multiple members from a dimension, there are family functions that can be used (.Parent, .Children, Ancestor(), Cousin(), .FirstChild, .LastChild, .FirstSibling, and .LastSibling). For this example, I’m using the .Children function.

Triple CrossJoin Using Children Function:

  • CrossJoin(CrossJoin(CrossJoin({[Measures].Children},{[Curr Year]}),{[Jan]}),{[Sale]})

Notice how [Original Price] was replaced with [Measures].Children. Rather than returning one member, this will return the following children from the “Measures” dimension:

Utilize these family functions to increase the CrossJoin function’s returned set.

One more thing to note. Substitution variables can be included within a CrossJoin. For example, let’s say I created the subvar &CurrMonth. I can replace Jan in the code, thus making the month variable.

Triple CrossJoin Using Substitution Variable:

  • CrossJoin(CrossJoin(CrossJoin({[Measures].Children},{[Curr Year]}),{[&CurrMonth]}),{[Sale]})

MaxL Syntax to Clear Data from a Region:

Next, let’s cover the MaxL syntax to clear data in the region specified by the CrossJoin. From the Essbase technical reference 11.1.2.3 pg. 894:

The entire CUBE-AREA portion must be enclosed in single quotes i.e.CUBE-AREA, which will define what portion of the database is going to be cleared.

And here are some more detailed notes on the syntax (also from the Essbase technical reference 11.1.2.3 pg. 897):

Based on the information laid out above, the line that I used in my MaxL statement turned out to look like this:

  • alter database ASOsamp.Sample clear data in region ‘CrossJoin(CrossJoin(CrossJoin({[Measures].children},{[Curr Year]}),{[&CurrMonth]}),{[Sale]})’ physical;

Prior to reloading data, I use this command line to clear the database in this region. This is to make sure that there is no stray data leftover in the cube that might cause discrepancies later on.

Feel free to leave any tips/advice on a more efficient method of utilizing CrossJoin!


Using MaxL Scripts to Create, Alter, & Grant Filters

Creating security filters and assigning them to different users/groups can be a time consuming process, especially if it is done manually. Luckily, there are some simple MaxL statements that can be used to significantly expedite the process. Here are the 3 that I’ve found to be most useful:

  • Create Filter
  • Alter Filter
  • Grant Filter

Create Filter:

The MEMBER-EXPRESSION must be enclosed in single quotation marks. It can be a comma-separated list as well (this also pertains to the Alter Filter syntax). Notice in the example below how commas are used to separate 3 different dimensions (Year, Measures, & Product) in the create filter syntax:

  • create filter Sample.Basic.filter1 read on ‘@IDescendants(“Year”), @IDescendants(“Measures”), @IDescendants(Product”)’;

For the FILTER-NAME portion, the application and database must be included preceding the filter name. This syntax will be used for Create, Alter, & Grant.

After running the batch, open EAS to verify that the filter was created correctly (I’ve included a generic version of my batch & MaxL files at the end of this post in case they may be helpful). Right click on the database and select Edit->Filters:

A list of all filters in the database will appear:

Select edit and the member specification assigned to the filter will pop up. All 3 dimensions that are outlined in the MaxL command should be accounted for:

Many times, the filter will need to be updated after it has been created. There is also a command line function for that…

Alter Filter:

For this example, we’ll add another dimension into the filter. Let’s add read access for @IDescendants(“East”). Here’s an example of the Alter Filter syntax:

  • alter filter Sample.Basic.filter1 add read on ‘@IDescendants(“East”)’;

After running the batch file, the filter now reflects the change that was made:

Now that the filter is built, it can be assigned to a user, group, or multiples of both using the Grant Filter command line function. However, prior to assigning a filter to a user/group, the user/group must be provisioned to have filter access to the application. This is done through Shared Services. We’ll use “Test_User1” as a sample user. Right click on “Test_User1” and select Provision:

Expand down on the Sample application until Filter appears. Highlight “Filter” and bring it across to the right side of the screen:

The selected roles should display “Filter” under Sample:

Click Save. Now, “Test_User1” is provisioned for the Sample application and the filter can be applied using the Grant Filter MaxL command.

Grant Filter:

Example of the Grant Filter syntax:

  • grant filter Sample.Basic.filter1 to Test_User1;

To verify that “filter1” has been granted to “Test_User1”, head back to Shared Services and right click on Sample->Assign Access Control:

Select “User Name” from the dropdown menu in the top left and click search. Highlight “Test_User1” and click the right arrow to bring the user to the Selected box on the right. Click Next:

“Test_User1” has been granted “filter1” and the user’s access should reflect this change:


Batch File:

call MaxlPath “MaxL File Path” Sample Basic userID password ServerId filter_log

MaxL File:

login $3 $4 on $5;

spool on to “Log File Path”;

create filter Sample.Basic.filter1 read on ‘@IDescendants(“Year”), @IDescendants(“Measures”), @IDescendants(“Product”)’;

alter filter sample.basic.filter1 add read on ‘@IDescendants(“East”)’;

grant filter Sample.Basic.filter1 to Test_User1;

logout;

spool off;

exit;


To take a deeper dive into the filter functionality, or to clarify any issues, check out the Essbase Technical Reference:

https://docs.oracle.com/cd/E40248_01/epm.1112/essbase_tech_ref.pdf


Force Excel to Calculate Dependencies In Order

Overview

If you have ever used custom functions in Excel, depending on the complexity of them, you have probably run into an issue where the accuracy of the results was sporadic. There is a quick solution. Use CTRL ALT SHIFT F9.

The lengthier explanation from Microsoft explains that the calculation of worksheets in Excel can be viewed as a three-stage process:

  • Construction of a dependency tree
  • Construction of a calculation chain
  • Recalculation of cell

With the introduction of complex VBA functions, the default calculation can produce inaccurate results because it doesn’t evaluate the dependency tree and calculation chain correctly.

So, if you have this issue, the most complete and thorough (and time consuming) calculation can be initiated by clicking CTRL ALT SHIFT F9. This forces the dependency tree to be rebuilt and recalculates the entire workbook. There are several levels in forcing Excel to calculate.

F9

Recalculates all cells that Excel has marked as dirty, that is, dependents of volatile or changed data, and cells programmatically marked as dirty. If the calculation mode is Automatic Except Tables, this calculates those tables that require updating and also all volatile functions and their dependents.
VBA: Application.Calculate

SHIFT F9

Recalculates the cells marked for calculation in the active worksheet only.
VBA: ActiveSheet.Calculate

CTRL ALT F9

Recalculates all cells in all open workbooks. If the calculation mode is Automatic Except Tables, it forces the tables to be recalculated.
VBA: Application.CalculateFull

CTRL ALT SHIFT F9

Causes Excel to rebuild the dependency tree and the calculation chain for a given workbook and forces a recalculation of all cells that contain formulas.
VBA: Workbooks(reference).ForceFullCalculation (introduced in Excel 2007)

References


Essbase: Loading Dates as Data

By default, only data values can be loaded into Essbase. However, sometimes it is helpful to load dates into an application (i.e. Product Inception Date). Follow these steps to enable an Essbase application to accept dates as data.

The first step is to edit the Outline in Essbase:

Navigate to the properties tab. “Typed measures enabled” will need to be set to True for dates to be activated:

Once typed measures are enabled, you will not be able to undo this setting:

Next, select the format that the date will display in Essbase:

Once the typed measures functionality has been enabled, select a member and set its properties to display date data. For this example, I created a member labeled “Inception Date” in the Measures dimension. Right click on the member and select Edit member properties:

Where the Type is set to Numeric, select Date from the dropdown menu:

Notice that the consolidation setting is set to “(^)Never”. This is the default setting for date members. Change this setting to “(~)Ignore” as Never Consolidate may cause some problems in an ASO outline if it is the first child in the hierarchy.

To load date data, make sure that the date is in the format selected from the properties tab. If mm/dd/yyyy is selected, represent that in the data file (i.e. 10/31/2011). In this example, there are 4 inception dates loaded for their respective products:

Notice that the inception dates are loaded to “Year N/A”. Rather than having to search for the relevant Year member for each Project, all Inception Date data is loaded to “Year N/A”. This keeps all of the Inception Date info in a more centralized location and facilitates quicker analysis.

Update (1/19/2015):

After loading the date data into Essbase, I was no longer able to export level 0 data. I would receive the following error:

  • Error: 1270042 Aggregate storage data export failed

After working with the Oracle Development team, they were able to conclude that there was an available workaround. This required that the Accounts dimension be switched from “Compression: True” to “Compression: False”:

After updating this setting and saving the outline, the level 0 data exported successfully.

One thing to note, even though this setting allows the data to be exported, the .txt file is about 3 times larger than if the Accounts dimension still had compression enabled. This is something to keep in mind if you’re dealing with a larger database as there is a very real possibility that performance will be affected…