1

Recommended Settings for Oracle Hyperion Products

Problem

Oracle has recommended settings for Internet Explorer (IE7, IE8, IE9, IE10 and IE11) when using Hyperion products.  I get this question a lot from my clients, so I thought I would share Oracles suggested settings.  Without changing these, there will be intermittent problems, and frustration points.

Solution

Configure browser to check for new version every time user visits a page

  • Open Internet Explorer
  • Go to Tools > Internet options > General
  • In “Browsing history” section click on “Settings” button and then select “Every time I visit the webpage” option
  • Click OK, then Apply.

Disable default pop-up blocking

  • Open Internet Explorer
  • Go to Tools > Internet options > Privacy tab
  • Uncheck “Turn on Pop-up Blocker”

Add Workspace URL to trusted sites

  • Open Internet Explorer
  • Go to Tools > Internet options > Security tab
  • Select “Trusted sites” from “Select a zone to view or change security settings” window, then click on “Sites” button.
  • Type your workspace URL in form http://workspaceserver:portnumber in “Add this website to the zone”
  • Uncheck “Require server verification (https:) for all sites in this zone”
  • Click Add, then Close.
  • Click OK and Apply.

Customize security settings

  • Open Internet Explorer
  • Go to Tools > Internet options > Security tab
  • Select “Trusted sites” from “Select a zone to view or change security settings” window
  • Select zone containing your Oracle Hyperion servers and click on “Custom level…” button
  • In “Miscellaneous” section enable options “Access data sources across domains” and “Allow script-initiated windows without size or position constraints”
  • In “ActiveX controls and plug-ins” section enable “Run ActiveX controls and plug-ins” and “Script ActiveX controls marked safe for scripting”.
  • Click OK
  • Click Apply, then OK

Enable option “Always allow session cookies”.

  • Open Internet Explorer
  • Go to Tools > Internet options > Privacy Tab > Advanced. Check the “Override automatic cookie handling”, accept the first and third party cookies and check the “Always allow session cookies” option.

Only for SSL enabled environments: Disable option “Do not save Encrypted Pages to Disk”.

  • Open Internet Explorer
  • Go to Tools > Internet options > Advanced Tab. In “Security” section uncheck the option “Do not save Encrypted Pages to Disk”.

Disable option “Enable Native XMLHTTP”. This setting is recommended only for customers using HFM 9.3.1 or older with IE 7. If you are using version 11.1.1.x of EPM products or newer, this option should be enabled.

  • Open Internet Explorer
  • Go to Tools > Internet options > Advanced Tab. In “Security” section uncheck the option “Enable Native XMLHTTP”.

Using Internet Explorer 9 Compatibility View option.

  • Open Internet Explorer
  • For 11.1.2.1.600 Planning and EPMA: Compatibility View should be enabled in Tools > Compatibility View Settings
  • For EPM 11.1.2.2 products: Go to Tools > Compatibility View Settings. Make sure EPM Workspace URL is not enabled for Compatibility View and uncheck all available options at the bottom of the pop-up window.

For products using JRE Plugin (Web Analysis, Performance Scorecard, Administration Services) make sure that a compatible version of plugin is installed on the client machine.

  • Check JRE Plugin certification for your EPM product in support matrix
  • Check installed Java version in Control Panel > Java > General > About. If required update Java version to a supported release.
  • Enable option “Always Auto-Download” in Control Panel > Java > Advanced > JRE Auto-Download=

Using Internet Explorer 11 Enterprise Mode. Limited support with EPM 11.1.2.2.500 and 11.1.2.3.500. For more information see Document 1920566.1.


FR Studio: Conditional Formatting and the Allow Expansion Function

This post looks at the “Allow Expansion” functionality in Financial Reporting Studio. “Allow Expansion” is a great feature, as it gives the user more flexibility when running and displaying reports. However, it can also require more setup work as it makes the report more complex. Two situations that I encountered recently:

  1. Adding a custom heading using conditional formatting
  2. Calculating formulas on expanded members

1) Adding a Custom Heading Using Conditional Formatting

For this example, I want to rename the account “PROMO”, to “Promotions” in the report. Typically, this setting can be changed by clicking on the “PROMO” cell and then editing the Custom heading in the properties box. However, with expansion enabled, the result will be that the member and its children will be renamed to “Promotions” with expansion enabled.

To demonstrate this, first we must enable expansion.  Highlight the entire row by clicking on the desired row number. Check the box next to “Allow Expansion” in the “Heading Row Properties” box. When expansion is enabled we will see that the custom heading will appear for all descendants of “PROMO”.

Run the report in the HTML preview, and click the arrow next to “Promotions” to see the children of the account. Notice in the screenshot below that both children now display as “Promotions”. How can we edit this so that the Custom heading only appears for “PROMO”, and not its children? This is where conditional formatting comes into play

The desired outcome is that both children will display their unique name as is stored in the dimension library. In order to accomplish this, some additional conditional formatting needs to be set up within the report:

The report needs to be given instructions on when to apply the custom heading. To apply this setting, we need to know what level or generation the account is, so that the rule will tell FR only to apply the custom heading on that specific account. For example, looking at the account structure below, “PROMO” is a Generation 7/Level 1 member of the hierarchy. We want the custom heading to only display for this level (i.e. “PROMO”) and allow the Generation 8/Level 0 members (i.e. children of “PROMO”) to display as usual.

The following 2 screenshots are examples of possible conditional formats for the member (based off the hierarchy above). Either of the 2 will work.

Select “Format Cells” and select the “Replace” tab. Enter in “Promotions” and click OK. After setting the conditional format, go ahead and run the report in HTML Preview again (Allow Expansion only works in HTML Preview, not in PDF Preview)

Expand on “Promotions” and notice the difference in formatting from before. The children will be displaying their unique member names as expected:

That took care of our first problem – How to set Custom Headings on Allow Expansion members using conditional formatting. Next up…

2) Dynamically Calculating using Allow Expansion

Another issue I encountered was that calculations didn’t update upon expansion of members. We’ll focus on the highlighted cell below to solve this issue:

The formula is a simple calculation, “PROMO”/”GROSS_SALES” or [A,3]/[A,2]:

When expanded, I want the calculation to update to show the relevant values for the children of “PROMO” i.e. the children will display as a percentage of “Gross Sales”. However, the values are static and do not update as expected. Notice that the 19.7% repeats itself for “Promotions” and its 2 children in the screenshot below. It seems that by hardcoding the formula to specific cells ([A,3] & [A,2]), the report only calculates “Promotions” / “Gross Sales”, instead of recalculating for the 2 children upon expansion (“425000/”Gross Sales” & “425040”/”Gross Sales”):

Rather than locking the numerator in place by selecting [A,3], we can improve the report by switching this value to reference the entire column [A]. Edit the formula by highlighting column B and typing the new formula into the formula box at the top of the report.

The new formula should look like this:

Instead of hardcoding the formula to one cell, the formula now has more flexibility for expanding members. Notice that the values calculate dynamically upon expansion this time around:

Overall, “Allow expansion” is a beneficial feature that allows users more flexibility with their reporting needs, but it sometimes takes a little more maneuvering to get the reports to display as expected.


FR Studio: How to Select Level 0 Descendants of a Specific Member

This post looks at the “Allow Expansion” functionality in Financial Reporting Studio. “Allow Expansion” is a great feature, as it gives the user more flexibility when running and displaying reports. However, it can also require more setup work as it makes the report more complex. Two situations that I encountered recently:

  1. Adding a custom heading using conditional formatting
  2. Calculating formulas on expanded members

1) Adding a Custom Heading Using Conditional Formatting

For this example, I want to rename the account “PROMO”, to “Promotions” in the report. Typically, this setting can be changed by clicking on the “PROMO” cell and then editing the Custom heading in the properties box. However, with expansion enabled, the result will be that the member and its children will be renamed to “Promotions” with expansion enabled.

To demonstrate this, first we must enable expansion.  Highlight the entire row by clicking on the desired row number. Check the box next to “Allow Expansion” in the “Heading Row Properties” box. When expansion is enabled we will see that the custom heading will appear for all descendants of “PROMO”.

Run the report in the HTML preview, and click the arrow next to “Promotions” to see the children of the account. Notice in the screenshot below that both children now display as “Promotions”. How can we edit this so that the Custom heading only appears for “PROMO”, and not its children? This is where conditional formatting comes into play

The desired outcome is that both children will display their unique name as is stored in the dimension library. In order to accomplish this, some additional conditional formatting needs to be set up within the report:

The report needs to be given instructions on when to apply the custom heading. To apply this setting, we need to know what level or generation the account is, so that the rule will tell FR only to apply the custom heading on that specific account. For example, looking at the account structure below, “PROMO” is a Generation 7/Level 1 member of the hierarchy. We want the custom heading to only display for this level (i.e. “PROMO”) and allow the Generation 8/Level 0 members (i.e. children of “PROMO”) to display as usual.

The following 2 screenshots are examples of possible conditional formats for the member (based off the hierarchy above). Either of the 2 will work.

Select “Format Cells” and select the “Replace” tab. Enter in “Promotions” and click OK. After setting the conditional format, go ahead and run the report in HTML Preview again (Allow Expansion only works in HTML Preview, not in PDF Preview)

Expand on “Promotions” and notice the difference in formatting from before. The children will be displaying their unique member names as expected:

That took care of our first problem – How to set Custom Headings on Allow Expansion members using conditional formatting. Next up…

2) Dynamically Calculating using Allow Expansion

Another issue I encountered was that calculations didn’t update upon expansion of members. We’ll focus on the highlighted cell below to solve this issue:

The formula is a simple calculation, “PROMO”/”GROSS_SALES” or [A,3]/[A,2]:

When expanded, I want the calculation to update to show the relevant values for the children of “PROMO” i.e. the children will display as a percentage of “Gross Sales”. However, the values are static and do not update as expected. Notice that the 19.7% repeats itself for “Promotions” and its 2 children in the screenshot below. It seems that by hardcoding the formula to specific cells ([A,3] & [A,2]), the report only calculates “Promotions” / “Gross Sales”, instead of recalculating for the 2 children upon expansion (“425000/”Gross Sales” & “425040”/”Gross Sales”):

Rather than locking the numerator in place by selecting [A,3], we can improve the report by switching this value to reference the entire column [A]. Edit the formula by highlighting column B and typing the new formula into the formula box at the top of the report.

The new formula should look like this:

Instead of hardcoding the formula to one cell, the formula now has more flexibility for expanding members. Notice that the values calculate dynamically upon expansion this time around:

Overall, “Allow expansion” is a beneficial feature that allows users more flexibility with their reporting needs, but it sometimes takes a little more maneuvering to get the reports to display as expected.


Why Can’t Planners Access Essbase

In Hyperion 11.1.2.1, there is a change in how security is deployed. If you are having an issue deploying Planning security with Essbase adhoc access, and the user can’t

  1. Access Essbase Adhoc
  2. Access FR reports using an Essbase connection
  3. Access Essbase directly

you are not alone. This is not classified as a bug, but it sure can cause a lot of frustration. If you have a user that needs access to Essbase directly, the user can’t be associated to ONLY Planning applications. For them to get access to Essbase, even to access the Planning application, they must have security to a native Essbase application (a NON Planning application).

From the Oracle Doc ID 1328741.1

SYMPTOMS

Trying to add the “Essbase” application access type to a Planning user in Shared Services so the user can access native Essbase applications using the Excel Add-in. Shared Services confirms the update when saved but when checking the user again, it only has “Planning” access. This also happens when trying to use the MaxL command to modify the application access type.

CAUSE

Starting in EPM v11.1.2, a user’s type (application access type) cannot be changed by Maxl, the EAS console or manually via Shared services console. The type is automatically assigned based on the roles that the user has.

  • If a user has a role on a Planning application only, then that user is treated as a Planning user.
  • If the user has a role on a Essbase application only, then the user is treated as an Essbase user.
  • If the user has roles on both Planning and Essbase applications the user is treated as a Planning and

Essbase user.

SOLUTION

In order for a Planning user to access native Essbase applications in the Excel Add-in, the user will need to be given access to a native Essbase application. For example, assign the Planning user “Read” access to the Demo application.


KScope 2012 Wrap-Up

Kscope was another fantastic event.  Kudos to those responsible for organizing it.  Thank you to all the speakers who volunteered their time and shared their knowledge.  The most frequent request Josh, Rob, and I had, was to make our presentations available.  They are available on the Kscope site, but many of you don’t have access.  So, we are happy to make them available here.

I also had tremendous feedback on the ribbon. At least half the participants in our sessions used it.  We got a couple of great recommendations as well.  With some luck (meaning my schedule slows down a little), I will be working on those in the near future.

Download Josh Forrest’s presentation on Hyperion Financial Reporting

Rob Donahue’s presentation on Hyperion infrastructure

Download Kyle Goodfriend’s presentation on Hyperion Planning


Increased Efficiency Utilizing Saved Objects in Financial Reporting

All developers understand the power of using objects during development activities, a concept that can be leveraged in the development of Oracle/Hyperion Financial Reports. Utilizing saved objects allows the development team to deliver a product in less time and provides the ability to quickly react to future report modifications. The information below (1) provides common saved object examples and (2) displays how saved objects are created and used.

What type of report information should be converted into saved objects?

The goal behind utilizing saved objects is to avoid the recreation of code, thus I find it valuable to turn all report header and footer information into saved objects. Items such as company logo’s, report title/sub-tile information, dimensional point-of-view selections, date & time stamps, page numbers and data source information make for great saved objects as they typically reside on all financial or management reports.

The usefulness of report objects may seem less important during the early stages of development, but as your reporting repository grows, their impact becomes increasingly important. For example, changing a company logo on a few reports is a minor incontinence, but making that same change to 50 reports could take hours to complete, resulting in the inefficient use of development/ maintenance time.

How are saved objects created and used?

Creating saved objects is a simple process that requires one additional step after the initial creation of your object. The example below walks through the process of creating a report title saved object. The same process will be used in the creation of all reporting saved objects.

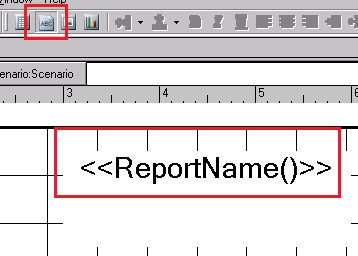
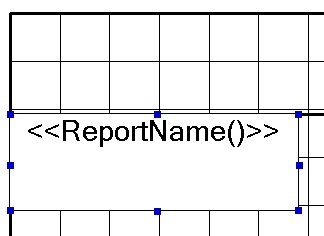
Step 1 – Create your Object:


Step 2 – Save the Object:

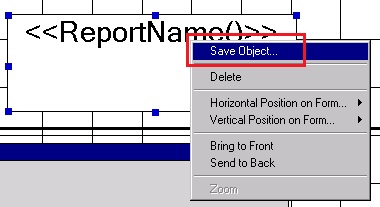
Right-click the object and select Save Object…

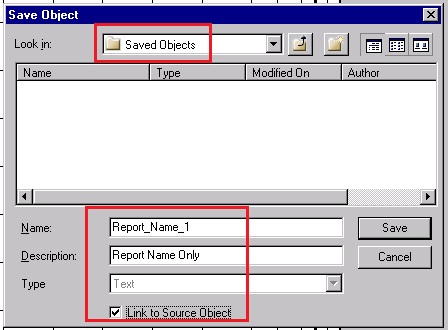
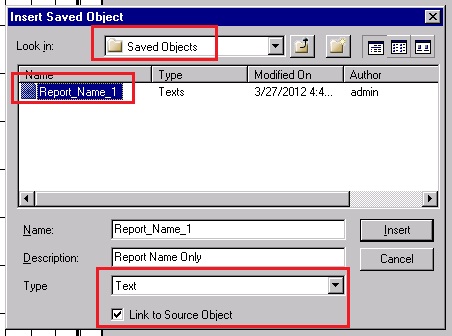
Best practice involves the creation of a Saved Object folder in the report repository where all saved objects will reside. Notice the use of this folder below.

IMPORTANT – Be sure to place a checkmark next to “Link to Source Object”. This link enables future modifications of this object to resonate across all reports where this object exists. This checkbox allows for the increased efficiency when developing and maintaining reports.

Once the report has been saved, notice the object name changes.


Step 3 – Use your Saved Object:

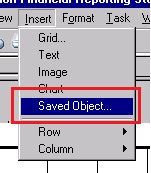
Once the object has been saved you can reference it in future report development via the link. Create a new report and insert the saved object.


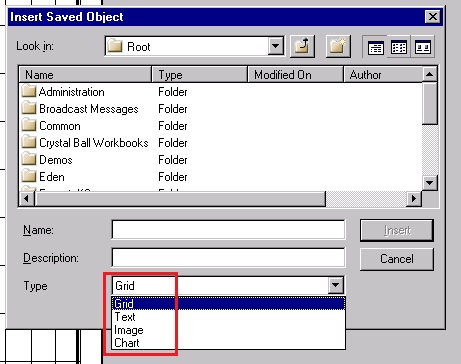
Be sure to select the Type of “Text” (It will always default to Grid) and place a checkmark next to “Link to Source Object”. 

FYI: When inserting saved objects you have 4 choices (Grid, Text, Image and Chart). Be sure to select the correct type in order to locate the desired saved object.

Note that when saved objects are inserted, they are placed in the body of the report by default; the developer will need to place the saved object in the correct position on the report.


Join Us In San Antonio!

KScope12 is the premier conference for Hyperion techies and up-and-comers. Whether you are looking to brush up on your skills, learn new skills, or see how others overcome challenges, you will want to participate in this event. If your organization values your development and has a budget for these growth opportunities, mark your calendar for June 24th through the 28th. Registration is open, and as more information is available, it will be published at In2Hyperion.

Presenting a topic is a great way to reduce the cost of the trip. It’s a great way to get your name out in the community as well. If you have something that you think would be valuable for other experts to hear about, submit an abstract.

We hope to see you there. Visit www.kscope12.com for all travel details and abstract submissions.


Creating Row and Column Templates

When developing it’s always best to avoid “recreating the wheel” and the same concept applies when building reports in Hyperion Financial Reporting. An important step in the design phase centers on report row and column sets; these are simply the groups of members which display in the rows and columns of each report. Any reports that “share” groups of members, whether in rows or columns, provide an excellent opportunity for creating Hyperion Row and/or Column Templates. These templates can then be referenced in additional reports, resulting in decreased development effort and less maintenance.

Benefits: When needing to create multiple reports which have similar or identical row and column sets, the user can save time by creating one standardized row and column set, saving it as an object in the repository, and reusing it for multiple reports.  The user also has the ability to modify a row/column template at any point and resave it into the repository which automatically updates all grids linked to the template.  
Creating Row & Column Templates
The building of Row and Column templates starts with building the “row set” or “column set” in a report grid. You use the FR Client to build row and column templates just as you would build FR reports. The example below will walk through creating a row template keeping in mind that the same steps will be taken to create a column template.

Step 1: Create a new FR report (using the Account Dimension for rows in my example).

Step 2: Highlight the members that make up the row set.
You can select any row (or combination of rows) to create the Row Template. Be sure you highlight the entire row as shown in the image below.

Step 3: Build the Row Template. (Screen shot images below)
Once you have highlighted the intended set of rows, select “File->Save Object…”. You will notice once you highlight the rows and decide to save an object; the “File Type” will default to “Row and Column Template”.

*Note that you should deselect the option for “Link to Source Object”. When you create the template this option is not necessary. You will select this option later when referencing the object in reports.

You will be asked to make selections for Suppression, Row Height, Column Width and Page Break options.

  • Suppression – you can save or inherit any application of suppression (that is, if zero, missing, or error) within the rows and columns selected.
  • Row Height – if you selected a row for your template, you can save or inherit any application of row height, which can be changed manually or numerically from the Row Height text box on the Row Properties property sheet, within the selected rows and columns.
  • Column Width – if you selected a column for your template, you can save or inherit any application of column width, which can be changed manually or numerically from the Column Width text box on the Column Properties property sheet, within the selected rows and columns.
  • Page Breaks – you can save or discard page breaks specified within the rows and columns selected.

Once you have made your selections, click OK. This completes the Row Template build process. Note that you don’t have to save the report which was just created – you can just choose to close it. The Row Template will have saved.

Adding Row & Column Templates to a Report
Once the Row Template has been created it can be referenced in any report – making sure that the Row Dimension(s) are the same as that in the Row Template. The steps below walk through pulling the Row Template into a report. *Note that the report which will contain the linked Row Template can also include additional data, formula, or text rows.

One requirement for adding the Row Template into the report is the addition of at least one data row. This data row can be hidden on your report, but Hyperion FR requires a minimum of one data row in addition to your Row Template.

Step 1: Inserting the Row Template
To add the Row Template, highlight the row below row 1, right-click and select “Insert Row and Column Template”.

Navigate to and select the needed Row Template. Be sure the check box for “Link to Source Object” is selected. Click “Insert”.

Notice that the Row Template has been added (identified by the yellow cells). You will need to save this report. When the report is run you will now see all rows from the Row Template linked to the report.

Modifying the Row & Column Template
In order to modify an existing Row Template you must open a report which references the Row Template. Note that you cannot open the actual Row & Column Template; it will result in an error message.

Step 1: Open a Report that references the Row Template

Step 2: Unlink the Source Object
To unlink the source object you must first highlight the Row Template rows on the report. You will be prompted to verify that you want to “Unlink the Object”… select “Yes.”

Step 3: Modify the Report
Make any necessary Row modifications such as adding Accounts or changing formatting.

Step 4: Re-Save the Object
Follow steps 2 and 3 from the “Creating Row & Column Templates” section above making sure to resave the template.  You will be prompted to verify if you want to “Overwrite the existing file”…select “Yes”. Once the modifications are finished and the Row Template is re-saved, any reports referencing that Row Template will automatically update.


Getting large numbers in FR Reports?

When using Workspace to view reports, some users have seen excessively large numbers that don’t belong. If you are having this issue, it could very well be because the default Essbase query engine in 11.1.1.x is the MDX query engine, which can cause documented bug 9062413. Essentially, this bug will cause users to see the same astronomical number in every cell that sits on an intersection to which the user does not have security access. Understandably, this can cause some concern. This issue is expected to be fixed in a future release, but until then, the query engine will need to be manually changed.
The first option is to fix the issue at a report level. This is a relatively quick process and is a good idea if you only have a handful of reports.  To change the query engine setting for a particular report, follow the steps below:

1. Open the report.
2. For each grid, select the entire grid.
3. Right-click and select Data Query Optimization Settings.
4. Deselect the option “Essbase Queries Use MDX.”
5. Save the report.

Repeat the above process for each report.

For users that have a larger number of reports, a better option may be to change the query engine in the properties file on the server.  The benefit to fixing the issue in the properties file is that changes only need to be made once, and all reports will reflect this change.
The file that needs to be edited is located on the Financial Reporting (app) server, typically on the path D:\<Hyperion Home>\products\biplus\lib where <Hyperion Home> represents the root location of the Hyperion install. The file that needs adjusted is the fr_global.properties file.
Open the properties file and add these lines:

# MDX Query Engine has been set as the default in Essbase 11.1.1.x. This can cause bug 9062413 
# which may cause unauthorized users to see a long series of numbers in each cell when running  
# reports. To solve this issue, the below line was added, which switches the query engine.
EssbaseUseMDX=false

Any line preceded by “#” is commented out. Therefore, these can say whatever you prefer, but should give anyone that views this file a good indication why this text is in the file.

Once the properties file has been updated, the following services must all be stopped in the following order, then started in the same order for the changes to take effect.

1. Hyperion Financial Reporting – Print Server
2. Hyperion Financial Reporting – Report Server
3. Hyperion Financial Reporting – Scheduler Server
4. Hyperion Financial Reporting – Web Application (Note – This service may be on the FR (Web) server, not the FR(App) server like the other three services.)

Note – This modification will apply to everyone using the server on which they are made, so be careful when making changes to a shared server.


Adding Font Types in Financial Reporting

The ability to import font types into Hyperion Financial Reporting is a common request by many companies, typically a request resulting from corporate reporting standards. Not only is this possible, it’s a quick and easy exercise that is detailed out below.

Step 1: Locate the Font Folder.

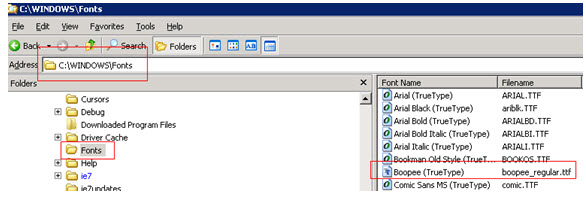
The font type files (normally identified by a .TTF or .ttf extension) can be found in the “Fonts” folder located in your Windows directory (Likely on your ‘C’ drive). The key here is locating this folder on the server where Hyperion Financial Reporting has been installed.

Step 2: Copying& Pasting the New Font File.

This is as easy as it sounds… just copy and paste the new file into this directory.

Step 3: Creating a Report.

Opening Hyperion Financial Reporting and create/modify a report. When selecting the font type, notice the new Font Type that was just added in Step 2 above. Note that it’s best to close the Financial Reporting client before importing the new Font file onto the server; this will insure that the client will recognize the new file.