Hyperion Planning applications often require multiple currencies.  Hyperion Planning includes a currency option that easily allows multiple currencies to be managed.  Allowing Planning to manage this introduces a couple of limitations and inherent costs. These can be avoided if currency is managed manually.

When the Hyperion Planning currency option is enabled, an additional 2 dimensions are required.  This raises the required dimensions from 6 to 8.  Most planning applications have a need for at least 2 to 3 custom dimensions.  Even smaller applications suffer greatly when adding the additional 2 dimensions.  So, by using the currency option, the ability to use custom dimensions is limited.  By adding a few accounts to hold the currency conversion and adding one dimension that has members for all the currencies, multi-currency applications can be handled with only one additional dimension.  If the currency option is not used, the currency calculations may be written more efficiently than the default calculations introduced with the currency option.

Another drawback with the currency option is that is only allows data input to the base currency.  The majority of the applications I have built that require multiple currencies require the input at more than base currency.  Assume a retail company has stores in a number of countries with different currencies.  Salaries may be budgeted in the local currencies, but the cost of the bags used by customers to carry merchandise out of the store is budgeted in USD.  The costs are distributed in USD based on units, and converted to the local currencies.

Lastly, using the currency option, because of the number of dense dimensions, limits the number of time periods.  Executing calculations is limited to using 64k of memory.  Applications that use something other than month (like week, or day) can regularly hit this limit.


Many clients have issues with Workspace logging users out when attempting to open/export certain types of documents. For example, a user logged into Hyperion Workspace attempts to open a Supporting Detail document, only to be prompted with a logout warning message before the document opens. The same can happen when a user attempts to export an FR report file (.DES file) from Workspace. After being logged out of Workspace, the user is able to log back into the application and open/export the necessary document. This issue can easily fixed by adjusting a few browser settings as shown below.

NOTE: Microsoft documents typically cause this logout issue (Excel, Word, PowerPoint).

1. Open your web browser (This blog entry will assume IE).

2. Select “Tools” -> “Internet Options…” from the menu bar.

3. Select the “Internet” option inside the “Security” tab. Select “Custom Level…”.

4. Navigate to the “Downloads” section and “Enable” Automatic prompting for file downloads. Click “OK”.


5. Now select the “Local Internet” option inside the “Security” tab. Select “Custom Level…”.


6. Navigate to the “Downloads” section and “Enable” Automatic prompting for file downloads. Click “OK”.


7. Finally, select the “Trusted sites” option inside the “Security” tab. Select “Custom Level…”.


8. Navigate to the “Downloads” section and “Enable” Automatic prompting for file downloads. Click “OK”.

9. Now that the settings have been set properly, Click “OK” on the “Internet Options” dialog box.

10. Close and re-open your web browser for the settings to take effect. Test these settings by logging into Workspace and opening a Supporting Detail document.


Often times with a Hyperion Essbase or Planning application, an allocation of data will be required.  Many times, the allocation is simply moving data from one member to another.  When the number of members involved is large, developing the script can be time consuming.  When the members frequently change, the maintenance of the calculation can be a nuisance.

When the members involved in the allocation are similar on both sides (the from and the to), the following method can be employed to speed the development and limit, or eliminate, any maintenance required.

Requirement

The application has 50 members in which the data needs to be moved.  The data originates from an account coming from the general ledger.  The data needs to be moved to a new member that doesn’t exist in the chart of accounts.  The new member will exist in a different part of the hierarchy.

Solution

The first step is to create a corresponding member for each of the 50 accounts that need allocated.  These accounts will be identical to the original 50, except they will be prefixed with a “D” identifying them as a dummy, or made up, account.  Each of these new accounts will have a UDA of “allocation.”  The prefix of the member and the UDA are not critical.  They will likely be something more meaningful to the requirements.

GL Acct   Dummy Account
500345   D500345
500578   D500578
607878   D607878

Once the hierarchy is ready to handle the allocation, the following function can be used.  In layman’s terms, this only executes on the new members added (identified by the unique UDA) and makes them equal to the corresponding member without the added prefix.  We will assume that this is being executed on a scenario that equals “Actuals.”

FIX(@UDA(“allocation”))
/* Make the new member equal to the old member */
“Actuals” = @MEMBER ( @SUBSTRING ( @NAME(@CURRMBR(“Account”)) , 1));
/* Clear the old member */
@MEMBER ( @SUBSTRING ( @NAME(@CURRMBR(“Account”)) , 1)) = #Missing;
ENDFIX

Let’s assume that the UDA is NOT added to the new, or dummy, member.  If the UDA is on the originating member, the calculation would look like this.

FIX(@UDA(“allocation”))
/* Make the new member equal to the old member */
@MEMBER ( @CONCATENATE(“D”,@NAME(@CURRMBR(“Account”)))) = “Actuals”;
/* Clear the old member */
Actuals = #Missing;
ENDFIX

Now we can break down these functions. Remember, the calculations loop through all members in all dimensions.  In this example, setting the result equal to “Actuals” is simply making the account that the calculation is looking at, at that particular point in the loop, equal to whatever is on the other side of the equation.

@MEMBER ( @SUBSTRING ( @NAME(@CURRMBR(“Account”)) , 1))
There are four functions used in this string.

  • @MEMBER will convert a string to a member name
  • @SUBSTRING requires 2 parameters (3 optional).  The first is the larger string from which you want to take a smaller string.  The second is where to start, with 0 being the first character.  The third is how many characters to include.  If this is left blank, it will take all the characters to the right of the second parameter.
  • @NAME will convert a member to a string.
  • @CURRMBR gets the current member of a specified dimension.

Putting this all together, this calculation (from inside out) is getting the current member of the Accounts dimension (“d345678”).  It converts that member to a string.  It takes all the characters to the right of the first character (“345678”).  Then it converts the string back to a member.  At this point, we can set that member equal to something.

@MEMBER ( @CONCATENATE(“D”,@NAME(@CURRMBR(“Account”))))
The functions here are the same as above, except we are not removing the “d.”  We are adding it.

  • @CONCATENATE accepts two parameters and will combine those two in to one string

Putting this all together, this calculation (from inside out) is concatenating two strings, a “D” and the current member of the Accounts dimension (“d345678”).  It then converts the string to a member. At this point, we can set that member equal to something.

Benefits

By using these functions, the calculations can be much smaller, quicker to develop, and completely maintained by the outline.  This effectively gives the user community ownership on the maintenance.


Microsoft Excel does a great job of calculating only what is needed.  If automatic calculation is turned on (and is by default), it only calculates formulas that have changed since the last calculations.  If automatic calculation is turned off, F9 will accomplish the same thing.

CTRL F9 goes one step further and calculates formulas that have changed, as well as the formulas dependent on them.

CTRL ALT F9 calculates all formulas in the workbook, regardless of whether they changed since the last calculation.

When custom functions are used, Microsoft Excel doesn’t always know the dependencies because the function can reference cells outside those provided in the function arguments.   When this occurs, using CTRL SHIFT ALT F9 is critical to ensure that all cells are calculated correctly.  This rechecks dependent cells and calculates all formulas regardless of whether they have changed since the last calculation.  This is the only way to ensure that all data is calculated.


Many of the Hyperion Planning and Essbase users still prefer to use the Essbase Add-In in conjunction with, or in place of, SmartView. As you probably already know, deploying the Essbase Add-In in version 11 has challenges. There is over 2GB of data that is required and the installtool.cmd file is not a simple installation that most users can administer without help. Because of the size, deploying it in a distributed package is extremely challenging. There are some instructions on various BLOGs that explain a way to deploy it manually, with edits to the registry. Any time I work with a client and mention editing the registry outside an automated install, this option is quickly disregarded.

In version 11.1.2, Oracle|Hyperion has added a self contained executable for the Essbase Add-In! The download is located in the Hyperion Essbase’s download page.


Regardless of whether the perception of using SmartView for large queries is good or bad, the reality is that finance and accounting users require the ability to pull large volumes of information out of Essbase.  The only limit that I am aware of in the days of the Excel Add-In was the maximum number of rows Excel would allow (assuming the Essbase application cache settings were high enough to support it).  With SmartView, there is a limit.  The limit is controllable very easily, however.  The error that users may question an administrator follows.

“Cannot perform cube view operation. OLAP error (1020011): Maximum number of rows [5000] exceeded.”

To increase the maximum number of rows a user can retrieve, or submit, edit the service.olap.dataQuery.grid.maxRows property in the essbase.properties file.  The default is 5000. While editing this property, it may be benefitial to evaluate the size if the columns (.olap.dataQuery.grid.maxColumns), which is set to 255 by default.

Once this is updated, restart the Hyperion services.

The location of the essbase.properties file is dependent on the version of Essbase installed.  Start by going to the server with APS installed.

Location for version 9.3
%HYPERION_HOME%\AnalyticProviderServices\bin directory

Location for version 11
%HYPERION_HOME%\products\Essbase\aps\bin\


The ability to import font types into Hyperion Financial Reporting is a common request by many companies, typically a request resulting from corporate reporting standards. Not only is this possible, it’s a quick and easy exercise that is detailed out below.

Step 1: Locate the Font Folder.

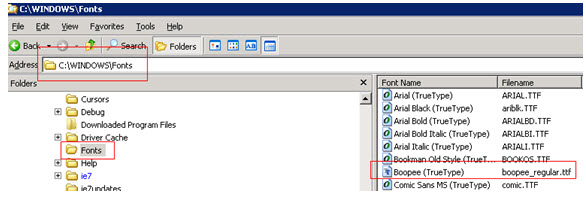
The font type files (normally identified by a .TTF or .ttf extension) can be found in the “Fonts” folder located in your Windows directory (Likely on your ‘C’ drive). The key here is locating this folder on the server where Hyperion Financial Reporting has been installed.

Step 2: Copying& Pasting the New Font File.

This is as easy as it sounds… just copy and paste the new file into this directory.

Step 3: Creating a Report.

Opening Hyperion Financial Reporting and create/modify a report. When selecting the font type, notice the new Font Type that was just added in Step 2 above. Note that it’s best to close the Financial Reporting client before importing the new Font file onto the server; this will insure that the client will recognize the new file.


Reporting solutions often require companies to filter out a top range of Key Performance Indicators; for example, the top 10 expenses related to marketing. Hyperion Financial Reporting makes this type of reporting easy for developers by providing the “Top” properties checkbox. The difficulty arises when a company requires a solution to display the bottom 10 – those 10 expenses that account for a majority of marketing related expense. Hyperion Financial Reporting has nothing built to provide this type of information.

As you might expect – knowing your smaller expenses is important but knowing the largest; those where you can improve margin, is vital. A solution to display the bottom 10 is detailed below; this solution displays the 10 largest negative values vs. displaying the 10 largest positive values.

The high-level solution includes the following functionality:
a.    Inserting a “Rank” column.
b.    Sorting on the “Rank” column.
c.    Adding conditional suppression for bottom 10.

Step 1:

Create a report grid with a formula column as the first column (Column A below).


Step 2:

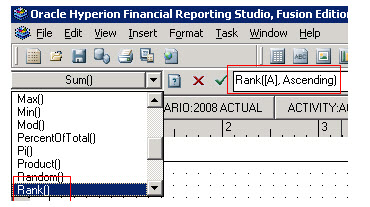
Insert the “Rank” function on the Formula Column. Be sure to choose the “Ascending” property. Adding “Rank” will order the rows from High-to-Low based on the data returned. The example below provides ranking off of Column ‘A’. The ranking is used on Step 4 when adding conditional suppression.

Step 3:

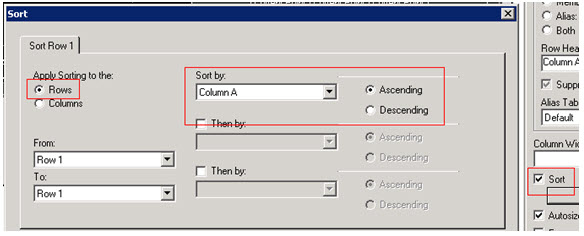
Apply row “Sort” to the grid. You find the “Sort” property by placing focus on the entire grid (left clicking the upper left-most cell). Choose to apply sorting to the “Rows”, Sort by “Column A”, and sort in “Ascending” order. Sorting will determine the order in which the data is displayed, Ascending or Descending. The Sorting is used on Step 4 when adding conditional suppression.

Step 4:

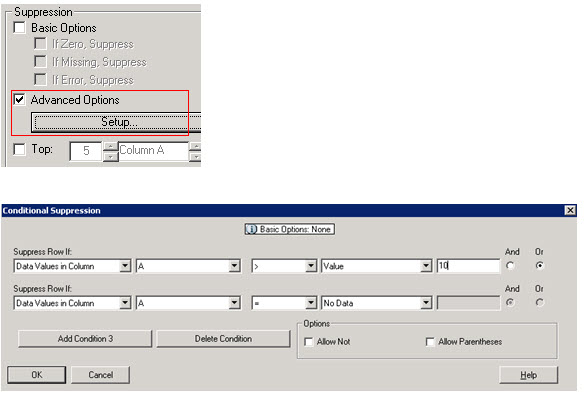
Add Conditional Suppression to the row(s). This logic will determine which data rows are ultimately displayed to the user. To add conditional suppression, highlight the row and click “Advanced Options”. Because the requirement is to show the bottom 10, suppression should hide any row with a “Rank” value greater than 10 (You will also want to suppress rows where “No Data” is returned).

When this report is run, only the bottom 10 will be displayed to the user… those marketing expenses with the largest negative values. The solution above will essentially do what a “Bottom” checkbox would have provided had Hyperion programmed this functionality into the application.


When I am introduced to business segments that use Hyperion Essbase, I always get asked the same question: “Can you explain what sparse and dense mean?”  Although I agree that users don’t HAVE to understand the concept, I contend that it is extremely valuable if they do.  It will not only help them become more efficient users, it goes a long way in helping them understand why something simple in Excel isn’t always simple in Essbase.  If users understand what a block is, and what it represents, they have a much better experience with Essbase.

If you are a relational database developer or a spreadsheet user, you tend to view data in 2 dimensions.  An X and Y axis is equivalent to the rows and columns in your spreadsheet or database table.  Essbase is a little different in that it stores data in 3 dimensions, like a Rubik’s Cube, so it has a Z axis.  Essbase databases refer to these “Rubik’s Cubes” as blocks.  An Essbase database isn’t one giant Rubik’s Cube; it could be millions of them.  The size and number of possible blocks a database has is determined by the sparse/dense configuration of the database.

An Essbase outline has a number of dimensions.  The number of dimensions can range in quantity and size, but each dimension is identified as a dense or sparse dimension.  The dense dimensions define how large each block will be in size (the number of rows, columns and the depth of the Z axis).  The sparse dimensions define the number of possible blocks the database may hold.  Assume the following scenario:  a database exists with 3 dense dimensions and 2 sparse dimensions.  The dense dimensions are as follows:

Net Income
Income
Expenses

Qtr 1
Jan
Feb
Mar

Version
~ Actual
~ Budget
~ Forecast

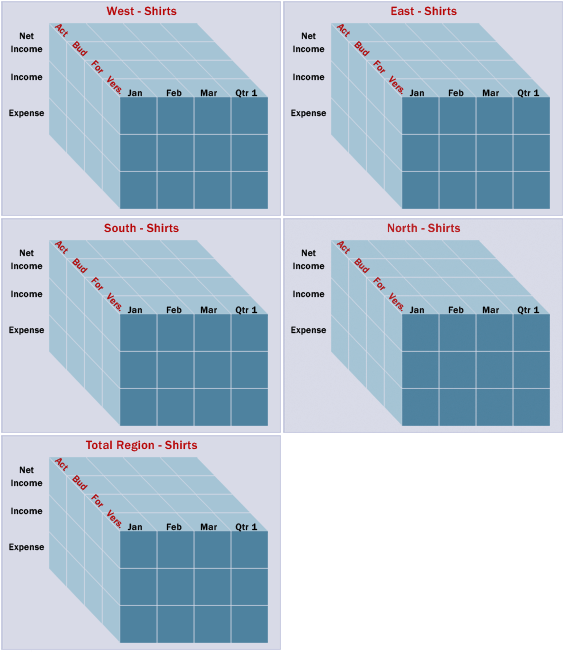
Remember, the dense dimensions define the size of blocks.  These dimensions would produce a block that looks like the image below.  Every block in the database would be the same.

For those more knowledgeable with Essbase design, this example assumes that no member is dynamically calculated or is tagged as a label to reduce complexity.


The sparse dimensions are below.

Total Product
Shirts
Pants

Total Region
North
South
East
West

The unique combinations of each sparse dimension has its own block.  There will be a block for Pants – North, one for Shirts – North, and so on.  Since there are 3 members in the Total Products dimension and 5 members in the Total Region dimension, there will be a total of 15 (3 x 5) blocks.  If a database has 5 sparse dimensions, all with 10 members, it would have a total possible number of blocks equal to 100,000 (10 x 10 x 10 x 10 x 10).  Below is a representation of the possible blocks for Shirts.