Tag Archive for: addin

Working with people new to Essbase every three to six months, I am always looking for ways to show users their hierarchies effectively. Many of them don’t have access to Essbase administration services or EPMA.  So, I always fall back to excel as a distribution method, as well as documentation, to show hierarchies.

Expanding hierarchies to all descendants is a great way to show small hierarchies, but, I am always asked to make it a collapsible hierarchy using the Excel grouping feature. The challenge of doing this manually to a hierarchy with thousands of members is that it is extremely time consuming and very error prone.

The following script can be added to any workbook to automate this effort.

Sub CreateOutline()
    Dim cell As Range
    Dim iCount As Integer
    For Each cell In Selection
        'Check the number of spaces in front of the member name 
        'and divide by 5 (one level)
        iCount = (Len(cell.Value) - Len(Trim(cell.Value))) / 5
        'Only execute if the row is indented
        If iCount <> 0 Then cell.EntireRow.OutlineLevel = iCount
    Next cell
    MsgBox "Completed"
End Sub

Setup

First, this sub routine has to be added to a workbook.  Open up the visual basic editor. Right click on the workbook in the project explorer window and add a new module. Paste the code above in the new module.  The editor is in different places in different version.  In Excel 2007 and 2010, the Developer ribbon is not visible by default.  To make it visible, go to the navigator wheel and click Excel Options.  There is a checkbox named Show Developer Ribbon that will make this developer ribbon viewable.

How To Use

First, open the member selection option in the Essbase add-in or smart view and select the parent.  Add all its descendants.  Alternately, change the drill type to all descendants and zoom in on the member of the hierarchy.

Retrieve, or refresh, the data, and make sure the indent is set so the children are indented.  Now, highlight the range of cells that has the hierarchy/dimension that the grouping should be applied. This should include cells in one column of the worksheet.  Open the code editor and place the cursor inside the sub routine you added from above and click the green play triangle in the toolbar to execute the script.  When this is finished, go back to the worksheet with the hierarchy and it will have the hierarchy grouped.

Excel limits the level of groupings to eight. If the hierarchy has more than eight levels, they will be ignored. Now, the hierarchy can be expanded and collapsed for viewing.

Shortcut keys or toolbar buttons can be assigned to execute this function if it is used frequently. If you are interested in doing this, there are a plethora of how-to articles on this topic.  This Google search will get you started if you choose to go down that path.

So, the next time you need to explain a hierarchy in Essbase, or distribute it in a common format, hopefully this script will help.

 

Thanks for all the great feedback on our Essbase Add-in Ribbon!  I have seen praise and thanks on the Oracle forums, network54, and a number of other popular hotspots.  I am constantly getting emails of gratitude.  Hundreds, if not thousands, of Hyperion customers are using the ribbon.  With the accolades, I am also getting some great suggestions for additional functionality.  In the spirit of giving back to the Hyperion community, I have every intention of implementing these requests.

What is new for the second release of the ribbon?  For those of you who used the Essbase Powerbar, you are aware of the option to save commonly used server connections.  I am happy to announce that it is now part of the In2Hyperion Essbase Add-in Ribbon feature set!

We moved the connection button that existed on the right, to the first button on the ribbon and renamed it Quick Connect.  From this menu button, users can select connect, add quick connection, or remove quick connection.  As connections are added, they will appear automatically in the Quick Connect menu.

The benefit of this option is that a user can select a “quick connection,” which remembers the server, application, database, username, and password.  Connecting to an Essbase application requires fewer clicks and less typing.  After quick connections are added, a file in My Documents named In2Hyperion.txt will exist.  This is where the connection information is stored.  The password is encrypted to ensure your information is not made available to other parties.

Download version 2.  To stay informed about future releases by signing up for our newsletter.  If you have any feedback, send us an email through the contact page.  Thanks again for all your support!


Many of the Hyperion Planning and Essbase users still prefer to use the Essbase Add-In in conjunction with, or in place of, SmartView. As you probably already know, deploying the Essbase Add-In in version 11 has challenges. There is over 2GB of data that is required and the installtool.cmd file is not a simple installation that most users can administer without help. Because of the size, deploying it in a distributed package is extremely challenging. There are some instructions on various BLOGs that explain a way to deploy it manually, with edits to the registry. Any time I work with a client and mention editing the registry outside an automated install, this option is quickly disregarded.

In version 11.1.2, Oracle|Hyperion has added a self contained executable for the Essbase Add-In! The download is located in the Hyperion Essbase’s download page.


Many people use Custom Lists in Excel – sometimes without even knowing.  If you have ever typed January into a cell and used autofill (click the dark plus sign, and drag across other cells) to create February through December, you have used Custom Lists.

Excel has a few Custom Lists setup for users when it is installed. Select the Tools / Options menu, and display the Custom Lists tab to view them.  Users can create their own Custom Lists in this dialog box by entering a list separated by commas or importing a range of cells that already includes a list.

For Essbase users who use the Hyperion Spreadsheet Add-In or SmartView, this can become a valuable tool.  Many times Essbase users will want to display a specific list of accounts, measures, products, etc.  Rather than selecting these from the member selection, or typing them, Custom Lists can be created and used to reduce the effort.

Let’s assume a user is responsible for a subset of the existing products and those products are only sold in a few of the markets.  The user may spend a lot of time creating the market list every time they create a new retrieve.  If the user creates a Custom List, they can automate this selection process.  A Custom List might include the following members.

Columbus,Cincinnati,Los Angeles,Tempe,Dallas,Austin,Seattle,Denver,Nashville

All the user has to do now is type Columbus in the first cell and use the autofill to list the rest of the markets.  This function can save those who frequently create add hoc reports a lot of time.

Custom Lists can be created for just about anything, are easy and quick to create, and are useful in a variety of situations.  www.In2Hyperion.com is not just for those in a technical capacity.  User related ideas, such as using Custom Lists, will become more prevalent on this site.  Sign up for our newsletter and receive notifications when more Excel tips for Essbase users become available.


When I am introduced to business segments that use Hyperion Essbase, I always get asked the same question: “Can you explain what sparse and dense mean?”  Although I agree that users don’t HAVE to understand the concept, I contend that it is extremely valuable if they do.  It will not only help them become more efficient users, it goes a long way in helping them understand why something simple in Excel isn’t always simple in Essbase.  If users understand what a block is, and what it represents, they have a much better experience with Essbase.

If you are a relational database developer or a spreadsheet user, you tend to view data in 2 dimensions.  An X and Y axis is equivalent to the rows and columns in your spreadsheet or database table.  Essbase is a little different in that it stores data in 3 dimensions, like a Rubik’s Cube, so it has a Z axis.  Essbase databases refer to these “Rubik’s Cubes” as blocks.  An Essbase database isn’t one giant Rubik’s Cube; it could be millions of them.  The size and number of possible blocks a database has is determined by the sparse/dense configuration of the database.

An Essbase outline has a number of dimensions.  The number of dimensions can range in quantity and size, but each dimension is identified as a dense or sparse dimension.  The dense dimensions define how large each block will be in size (the number of rows, columns and the depth of the Z axis).  The sparse dimensions define the number of possible blocks the database may hold.  Assume the following scenario:  a database exists with 3 dense dimensions and 2 sparse dimensions.  The dense dimensions are as follows:

Net Income
Income
Expenses

Qtr 1
Jan
Feb
Mar

Version
~ Actual
~ Budget
~ Forecast

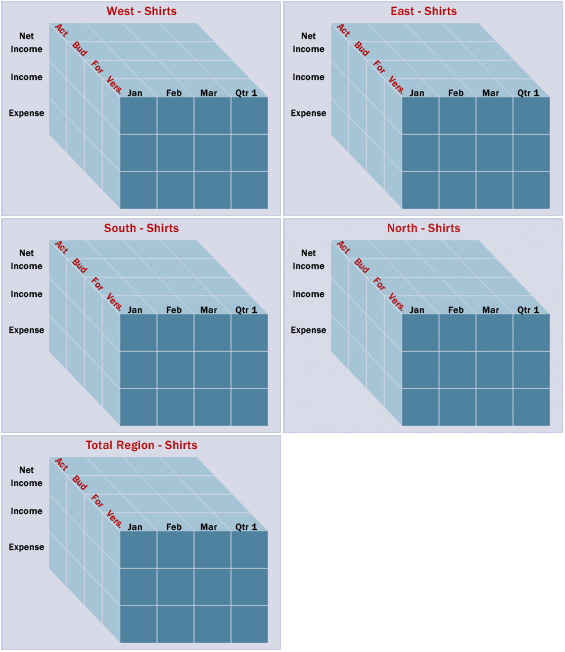
Remember, the dense dimensions define the size of blocks.  These dimensions would produce a block that looks like the image below.  Every block in the database would be the same.

For those more knowledgeable with Essbase design, this example assumes that no member is dynamically calculated or is tagged as a label to reduce complexity.


The sparse dimensions are below.

Total Product
Shirts
Pants

Total Region
North
South
East
West

The unique combinations of each sparse dimension has its own block.  There will be a block for Pants – North, one for Shirts – North, and so on.  Since there are 3 members in the Total Products dimension and 5 members in the Total Region dimension, there will be a total of 15 (3 x 5) blocks.  If a database has 5 sparse dimensions, all with 10 members, it would have a total possible number of blocks equal to 100,000 (10 x 10 x 10 x 10 x 10).  Below is a representation of the possible blocks for Shirts.