Tag Archive for: Essbase

Many of the Hyperion Planning and Essbase users still prefer to use the Essbase Add-In in conjunction with, or in place of, SmartView. As you probably already know, deploying the Essbase Add-In in version 11 has challenges. There is over 2GB of data that is required and the installtool.cmd file is not a simple installation that most users can administer without help. Because of the size, deploying it in a distributed package is extremely challenging. There are some instructions on various BLOGs that explain a way to deploy it manually, with edits to the registry. Any time I work with a client and mention editing the registry outside an automated install, this option is quickly disregarded.

In version 11.1.2, Oracle|Hyperion has added a self contained executable for the Essbase Add-In! The download is located in the Hyperion Essbase’s download page.


Regardless of whether the perception of using SmartView for large queries is good or bad, the reality is that finance and accounting users require the ability to pull large volumes of information out of Essbase.  The only limit that I am aware of in the days of the Excel Add-In was the maximum number of rows Excel would allow (assuming the Essbase application cache settings were high enough to support it).  With SmartView, there is a limit.  The limit is controllable very easily, however.  The error that users may question an administrator follows.

“Cannot perform cube view operation. OLAP error (1020011): Maximum number of rows [5000] exceeded.”

To increase the maximum number of rows a user can retrieve, or submit, edit the service.olap.dataQuery.grid.maxRows property in the essbase.properties file.  The default is 5000. While editing this property, it may be benefitial to evaluate the size if the columns (.olap.dataQuery.grid.maxColumns), which is set to 255 by default.

Once this is updated, restart the Hyperion services.

The location of the essbase.properties file is dependent on the version of Essbase installed.  Start by going to the server with APS installed.

Location for version 9.3
%HYPERION_HOME%\AnalyticProviderServices\bin directory

Location for version 11
%HYPERION_HOME%\products\Essbase\aps\bin\


“Validation”

In installment #3 of this series we installed and configured the 11.1.x software.  In this installment we will discuss what Infrastructure Architect will do before the environment is turned over to the development or migration teams.

It is quite frustrating to the developers if the environment is not fully functional when they start using the system.  Additionally, it is very frustrating for the installation architect to have users in the environment as debugging of issues is occurring.  Each installation and configuration project plan should include at least a day or two to review an environment, restart it a few times, check out the logs, and then test the functionality of all installed components.  The number of items to validate depends on the products used and licensed by the client but it should start with the following and adjust as necessary.

  • Shared Services
  • Essbase
  • EAS and Business Rules
  • Planning
  • Financial Reporting
  • Web Analysis
  • Interactive Reporting
  • SQR
  • Workspace
  • Smart View and Provider Services
  • Financial Management
  • Financial Data Quality Management
  • Oracle Data Integrator
  • Data Relationship Management
  • Strategic Finance

The Installation Architect will test the use functionality of each of the installed product to ensure there are no errors.  This activity takes a combination of functional and technical ability.  The installation architect must know how the application works from the interface as well as understanding what any potential errors mean and how they may be corrected.  I’m not suggesting the infrastructure engineer know how to create a P&L report or design a Planning application, but the ability to navigate the user interfaces and test functionality eliminates the problems of encountering them after development has begun.

Early in my exposure to these applications, I’d spend a lot of time with a developer or functional user of the applications to show me how to test the system.  I’d ask them to tell me the first thing they try to do when they get a new environment.  It is always useful to know more about how the applications are used.

Some of the common problems that occur include the following.
EPMA dimension server does not resolve in Workspace
Shared Services doesn’t find users in Active Directory
Cannot create Planning Application
Cannot create FDM Database
ODI repositories are not available
Common Essbase commands do not work

The solutions to some of these problems may range anywhere from Database Access Permissions, Windows Security Rights, DCOM Settings, or incorrect Active Directory Setup.  Over the past few years working on dozens of installation, I’ve seen all of these.  From encountering many of these, the pre-installation requirements covered in installment #2 have been improved.  Some of these problems don’t arise until functionality is tested.  It’s important to test each installation and environment.  I’ve had situations where the development environment will test out fine and the QA Environment will have issues.  Each installation is usually different from each prior installation because of server settings, security policies, database settings, firewalls, or some other nuance.

If there are problems with the functionality there are a number of resources available to assist in troubleshooting.  I find the Oracle Technology Network Forum to be very useful.  I recommend anyone looking to work in this space, get an ID, and get involved.  You may also find some real useful things on blogs like this or a number of other very experienced bloggers.  There is a wealth of information at Oracle Support in the knowledge base.  In addition, if you have a support agreement with Oracle, register here and you can get support from Oracle.

Assuming everything is functioning as expected, the environment is turned over to the appropriate support person, or maybe support falls on the same individual that did the installation.  Either way, there is a lot of information that needs to be collected.  In the next installment, we’ll look at the information that should be compiled to capture the state of the environment as it was at the end of the installation as well as information that is useful to those that will be using the system.


Backing up Essbase can be accomplished in a number of ways.  Some methods suit some organizational cultures better than others.  It is hard to argue that one method is better than another for this reason.  Below are two methods, and the pros and cons of each.

There are a number of factors that must be considered.  If the environment uses some of the new Hyperion tools, like EPMA, then one must allow consideration for the synchronization of the warehouse that holds the data for EPMA.  Where the different Hyperion applications (Shared Services, the web server, etc.) that work together reside is also a factor.

To minimize the complexity of this discussion, only information related to Essbase will be discussed.

Backup the entire server

Pros:  An image of the entire server is available in the case of disaster recovery and is normally in sync to that point in time of failure
Cons: Speed, cost, and data availability

Taking an image of the entire server is one option.  This will provide the most secure backup strategy.  If there is a hardware failure, getting back to the point of failure does not require a server rebuild.  This method is probably the quickest solution to restore all Essbase applications.  Price, speed, and data availability must be considered with this solution.  Taking an image of a server can be very time consuming and quite often, Essbase must be turned off for this to occur without skipping critical files.  Because a large amount of data is backed up, a large amount of storage is required. The time Essbase is down can have a significant impact on the people using Essbase.  There can be a very expensive price tag for the amount of tape and/or SAN that is required.  To effectively image a server without significant downtime, techniques like shadow copy or data mirroring are likely used.

Backup critical Essbase files

Pros: Speed, cost, data availability
Cons: Recovery time is sometimes longer, more effort if a complete system failure occurs, and data from the most recent backup to the point of failure is lost

The files required to be backed up to recover from a catastrophic event are actually very small in size.  The bulk of the amount of data related to Essbase is the pag and ind files, or the data and index files.  These files, in most environments, consume at least 90% of the total space.  If these are ignored during the backup process, the process can be much faster, far less expensive, and Essbase is not required to be off for the backup to occur.  Although this method can take longer to restore an entire server, it can be quicker to restore a few applications.  In most situations, a faster, cheaper solution, where the availability isn’t negatively impacted, is a far more palatable option.  This is only an option if you have either the data that sources the databases or data exports (input or level 0) of the Essbase databases.  If these are available, the databases can rebuild the pag and ind files.

Deciding on a backup method

Determining the best option boils down to cost and resources.  Taking an image of the server requires at least 2 times more disk space, a more complicated network/hardware infrastructure, and far more resources to build and store sufficient backup versions.  What is gained is an up to the minute backup.  If the cost associated with this method outweighs the cost of having to rebuild the data that was loaded between the time of failure and the last backup, then this solution is the best option.  In my opinion, it is hard to justify the investment in the capital required to support this for what little is gained.

First, disasters rarely happen.  With the RAID and SAN solutions today, disk failures that cause data loss are not the main reason a server fails, a hardware component failure is.  If the component that fails is replaced, the data doesn’t have to be restored.

Second, if a database becomes corrupt and unusable, a complete reload of the data is required.  Many times corruption can exist, unnoticed, in a database for weeks.  If the data is not available to reload, it is possible to lose weeks or months of data.

Third, if a disaster does occur, any data sourced from another system can be recreated.  Remember, the only data required is the data that has changes prior to the most recent backup, which is normally the previous night.  The data loaded by users, either through Hyperion Planning web forms or spreadsheets (Excel Add-In or SmartView), also exists somewhere else.  It might be frustrating for users to enter it again, but the data does exist and can be restored, normally with minimal effort.  In very large environments, this backup method can save millions of dollars.

Whether the decision is made to mirror the server, backup the critical Essbase files excluding the data consolidations and index files, or some method in the middle, it is wise to test the disaster recovery plan.  There is nothing worse than restoring from a backup only to find out that it is useless.

The second installment of this topic will be dedicated to how and what is required to have a secure DR plan if the pag and ind files are ignored in a backup strategy.



Fragmentation occurs naturally when a database is used frequently by adding, deleting, and modifying the data within it.  The more changes occur, the more fragmented the database gets as data becomes scattered through the pag files, and the size of the database becomes inflated.  The index files have to compensate for this, and what starts as a simple map becomes a spaghetti mess.

If you are unfamiliar with Essbase’s storage method, here is a brief overview.  Essbase has two sets of files related to the data stored in a database.  The numeric data is stored in files with an extension of pag.  Essbase also has files with an ind extension.  These index files are used to store the pointers to the data in the pag files.  As data is requested, Essbase must read the index files to know where the data is located in the pag files.

The result of a more fragmented database can have drastic effects on size and performance.  If you have a database where performance continues to decrease, fragmentation might be the source of the problem.  Performance degradation can occur over weeks or months, but can also occur much more frequently.  Databases with frequent data loads, or updates, can be impacted within a day.

A great way to identify the impact fragmentation is having with a database is to export your data (level 0 in most cases), reload it, and execute the process in question.  By exporting and reloading the data, fragmentation can be completely eliminated.

For more information about pag or ind files, please refer to the database administrator’s guide provided by Oracle.


I had the honor of presenting at the September 2009 user group in the Hyperion track for those who attended the Ohio Valley Oracle Application User Group in Louisville.  The presentation focused on Maxl best practices, and how to integrate the results of maxl into other technologies.  The presentation was driven from a project completed late last year.  A recent client spent a tremendous amount of time verifying the results of daily and monthly processes.

Adding some consistency in the Maxl scripting, I integrated the results of the scripts, including the error and process logs, with .NET to produce a website that summarized the state of nearly 50 processes.  Administrators were able to view a web page that showed real time status of all their applications, including links to error logs.  The increased productivity of the administrative staff created a positive ROI in the first month of use.


Many people use Custom Lists in Excel – sometimes without even knowing.  If you have ever typed January into a cell and used autofill (click the dark plus sign, and drag across other cells) to create February through December, you have used Custom Lists.

Excel has a few Custom Lists setup for users when it is installed. Select the Tools / Options menu, and display the Custom Lists tab to view them.  Users can create their own Custom Lists in this dialog box by entering a list separated by commas or importing a range of cells that already includes a list.

For Essbase users who use the Hyperion Spreadsheet Add-In or SmartView, this can become a valuable tool.  Many times Essbase users will want to display a specific list of accounts, measures, products, etc.  Rather than selecting these from the member selection, or typing them, Custom Lists can be created and used to reduce the effort.

Let’s assume a user is responsible for a subset of the existing products and those products are only sold in a few of the markets.  The user may spend a lot of time creating the market list every time they create a new retrieve.  If the user creates a Custom List, they can automate this selection process.  A Custom List might include the following members.

Columbus,Cincinnati,Los Angeles,Tempe,Dallas,Austin,Seattle,Denver,Nashville

All the user has to do now is type Columbus in the first cell and use the autofill to list the rest of the markets.  This function can save those who frequently create add hoc reports a lot of time.

Custom Lists can be created for just about anything, are easy and quick to create, and are useful in a variety of situations.  www.In2Hyperion.com is not just for those in a technical capacity.  User related ideas, such as using Custom Lists, will become more prevalent on this site.  Sign up for our newsletter and receive notifications when more Excel tips for Essbase users become available.


There are a host of new features in version 11.  As with most product releases, there are the typical improvements related to memory, scripting, and stability.  But, there are some other, very notable, functional additions that might peak your interest.

Lifecycle Management

Shared Services now provides a consistent way to manage environments.  This console gives administrators the ability to compare applications, search for artifacts, and perform artifact migrations. It comes with a command line tool to automate tasks, as well as a full API for those who want to customize the process even further.

Typed Measures

Essbase now stores text!  Well, somewhat.  Text measures give administrators a way of storing a value other than a number in a data intersection.  Technically, it still stores numbers, but it represents a string.  A member in the measures dimension can have a text attribute.  This member is associated with an enumerated list.  Each member in that list has an index number, which is what is in the database.  When reporting is done, that number is converted to the associated text value in the enumerated list.  Members can also be tagged as Date, which changes the formatting to; you guessed it, a date.

Varying Attributes

Attributes have been around for a while now in Essbase.  Some people hate them and some love them.  They definitely have their place in the design of a database.  One limitation has been the inability to walk forward attributes over time.  For example, assume we have an attribute that identifies our customers into tiers based on their credit score.  If a customer’s score changes such that they move to a higher or lower tier, the history is lost because their attribute is the same for all time periods.  Not anymore.  Varying attributes adds the capability of Essbase to store, and calculate measures for attributes that vary over multiple dimensions.

Backup and Recovery

I have seen many methods to making sure Essbase applications are secured.  In version 11, there are some new options for BSO databases.  First, an option in EAS exists to backup the entire database, including its data and all of its objects, to one file.  When changing things rapidly through the day, this is a nice feature to ensure you don’t lose valuable work.  The entire database can easily be restored.  This is much quicker than manually archiving all the objects (calc scripts, load rules, outlines, and reports) and keeping data exports.

Secondly, Essbase now includes the option to log transactions and replay them.  With this option turned on, Essbase applications can be restored with the option to replay all transactions that occurred after the backup occurred.  Now, a database can be restored to a specific point in time.

ASO Data Management

ASO now includes Maxl scripting to enable administrators to clear data from regions of a database in two ways.  The first and most obvious is to remove the values from the database.  The second is the ability to copy the data into another member as the inverse, resulting in a total of zero.

The use of Environment Variables

If your process management uses variables to decrease maintenance tasks from, this might be something that will intrigue you.  Version 11 has access to not only Essbase variables, but operating system environment variables as well.

Monitoring Environment Reponses

Many environments take advantage of partitioning.  Now, there is a way to evaluate the cost of using partitions.  Using the ENABLE_DIAG_TRANSPARENT_PARTITION configuration setting in the essbase.cfg file, administrators can log transaction response times.

Common Log Locations

Version 11 organizes all log files in one location.  This is a very nice improvement.  Rather than searching through each products’ directory tree for the area logs are stored, they are now located in one common folder, with a folder for each of the Hyperion products.

Override Implied Shares

Essbase now includes an option in the outline management section to ignore the default setting for implied shares.  This can be very helpful when using partitions, as well as a host of other situations.

Notable Calculations Additions

Now that members can carry a text or date value, there are a host of functions that open up a whole new realm of possibilities.  DATEROLL will increase a value based on a specific time interval.  DATEDIFF will take the difference between two dates at the interval designated.  DATEPART will pull the time period (week, month, day, etc) from any date.  These operations were difficult at best, in previous releases of Essbase.


Users of Essbase have some control over the performance of a database and how responsive it is when retrieving data.  With a basic understanding of how Essbase stores data, users can optimize performance by changing the order of the dimensions and members in a report.

It might be helpful to read our article on sparse and dense dimensions.  Here is a brief overview:

An Essbase database is comprised of thousands, if not millions or billions, of data blocks.  Each block of data, and its size, is defined by the dense dimensions in the Essbase outline.  The volume of blocks is dictated by the unique combinations of sparse dimension members.  If Time and Accounts are dense, each block created would hold all the months for every account.  If Organization and Product are sparse dimensions, there would be a block for each unique combination of Organization and Product.  A block would exist for Center 10 / Product A, as well as Total Organization / Total Product.  If the outline has 20 members in Organization and 15 members in Products, the database could have up to 300 independent blocks.

If a report is written to show an entire income statement for all 12 months for Total Product and Total Organization, how many blocks would have to be queried?  Remember, there is a block for each unique member combination of Organization and Product.  The answer is one, because there is a block for Total Organization/Total Product that includes every account and every member in the time dimension.

How many blocks would be accessed if a report pulled Total Sales (a member in the Accounts dimension) in January for every product?  Since the Product dimension is sparse and there are 15 products, 15 blocks would have to be opened to return the results.

Here is where your understanding of what sparse and dense represents will help you improve your reports.  Opening a data block, reading the contents, and closing it, is similar to opening, reading, and closing a spreadsheet.  It is much faster to open one spreadsheet, or block, than 15 spreadsheets.  So, if the database retrieves are written in such a way to minimize the number of blocks that need to be accessed, or the order in which they are accessed, performance can improve.

I will agree that if data for all 15 products is needed for the report, all 15 blocks have to be opened.  There is no way around that.  That said, often times users will build one worksheet for income statement and one worksheet for balance sheet.  This means that the report is making two passes on the same blocks.  In theory, it takes twice as long to open/read/close a data block 2 times than it does once.  It is faster to have the income statement and the balance sheet accounts in one worksheet, which only makes one pass on the required blocks.  One worksheet for Income Statement and one for Balance Sheet can be created with cell references to the worksheet that has the retrieved data, if 2 separate reports are required.

I frequently see another example of a report requiring multiple passes to the same data block.  Using our example dimensions above, assume product information is required in a report for multiple accounts.

    Jan Feb Mar
Income Product A      
Income Product B      
Income Product C      
Income Product D      
Expense Product A      
Expense Product B      
Expense Product C      
Expense Product D      

The Essbase retrieve above would start from the top of the spreadsheet and move down the rows to retrieve the data from Essbase.  This cycle would open the Product A block, then B, C, and D, and retrieve the associated income for each.  It would then have to reopen the same 4 blocks to access expenses.

The following example, again going from top to bottom, would access both income and expense while the block is open.  The way this retrieve is setup, it eliminates the need to access the same block multiple times, yet still pulls the required information.

    Jan Feb Mar
Income Product A      
Expense Product A      
Income Product B      
Expense Product B      
Income Product C      
Expense Product C      
Income Product D      
Expense Product D      

These examples are very small.  In a real world example, a report of this size would not produce significant variances in the time it takes to retrieve them.  Users often have spreadsheets that are hundreds of rows long and take minutes to retrieve.  In these situations, eliminating the need to access the same block multiple times can produce notable improvements in the time it takes to retrieve data from Essbase.

With a basic understanding of how your database is setup, users of Essbase can help themselves with some simple changes to the format of the retrieve worksheet.  If access to the dimension properties in your database is unavailable, ask your system administrator to supply them for you.


When I am introduced to business segments that use Hyperion Essbase, I always get asked the same question: “Can you explain what sparse and dense mean?”  Although I agree that users don’t HAVE to understand the concept, I contend that it is extremely valuable if they do.  It will not only help them become more efficient users, it goes a long way in helping them understand why something simple in Excel isn’t always simple in Essbase.  If users understand what a block is, and what it represents, they have a much better experience with Essbase.

If you are a relational database developer or a spreadsheet user, you tend to view data in 2 dimensions.  An X and Y axis is equivalent to the rows and columns in your spreadsheet or database table.  Essbase is a little different in that it stores data in 3 dimensions, like a Rubik’s Cube, so it has a Z axis.  Essbase databases refer to these “Rubik’s Cubes” as blocks.  An Essbase database isn’t one giant Rubik’s Cube; it could be millions of them.  The size and number of possible blocks a database has is determined by the sparse/dense configuration of the database.

An Essbase outline has a number of dimensions.  The number of dimensions can range in quantity and size, but each dimension is identified as a dense or sparse dimension.  The dense dimensions define how large each block will be in size (the number of rows, columns and the depth of the Z axis).  The sparse dimensions define the number of possible blocks the database may hold.  Assume the following scenario:  a database exists with 3 dense dimensions and 2 sparse dimensions.  The dense dimensions are as follows:

Net Income
Income
Expenses

Qtr 1
Jan
Feb
Mar

Version
~ Actual
~ Budget
~ Forecast

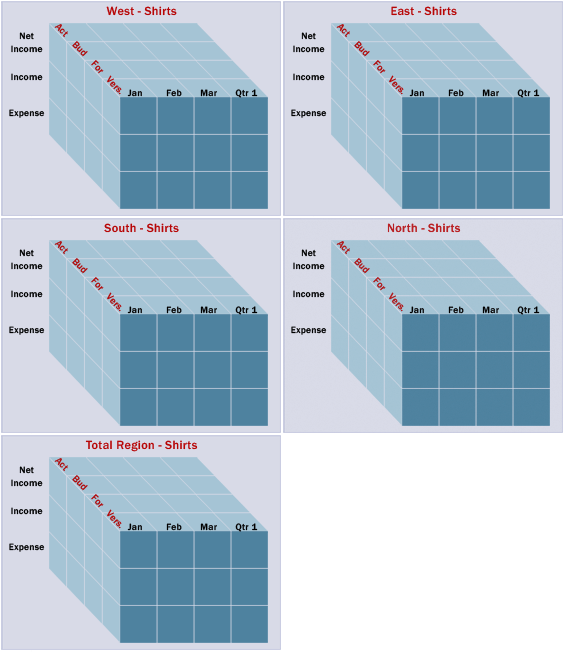
Remember, the dense dimensions define the size of blocks.  These dimensions would produce a block that looks like the image below.  Every block in the database would be the same.

For those more knowledgeable with Essbase design, this example assumes that no member is dynamically calculated or is tagged as a label to reduce complexity.


The sparse dimensions are below.

Total Product
Shirts
Pants

Total Region
North
South
East
West

The unique combinations of each sparse dimension has its own block.  There will be a block for Pants – North, one for Shirts – North, and so on.  Since there are 3 members in the Total Products dimension and 5 members in the Total Region dimension, there will be a total of 15 (3 x 5) blocks.  If a database has 5 sparse dimensions, all with 10 members, it would have a total possible number of blocks equal to 100,000 (10 x 10 x 10 x 10 x 10).  Below is a representation of the possible blocks for Shirts.